If you have a FileMaker server that you want to ensure high availability, Amazon’s AWS Route 53 service has some functionality that you’ll want to know about. For this post, I’m going to show how you can set up monitoring and alarms for the XML interface on FileMaker Server.
Positioned somewhat incongruously* in Route 53, AWS’ DNS service, are Health Checks. Besides providing a domain’s DNS, this service allows you to hit a URL at regular intervals and check the returned result. Although mainly for servers hosted using AWS, you could use this for any server with external connectivity. There is a small fee associated with using this service, unlike some of the the AWS CloudWatch features. Pricing ranges from $0.50 / month for AWS hosted non-SSL without latency data, to $2 / month for SSL + latency + non-AWS.
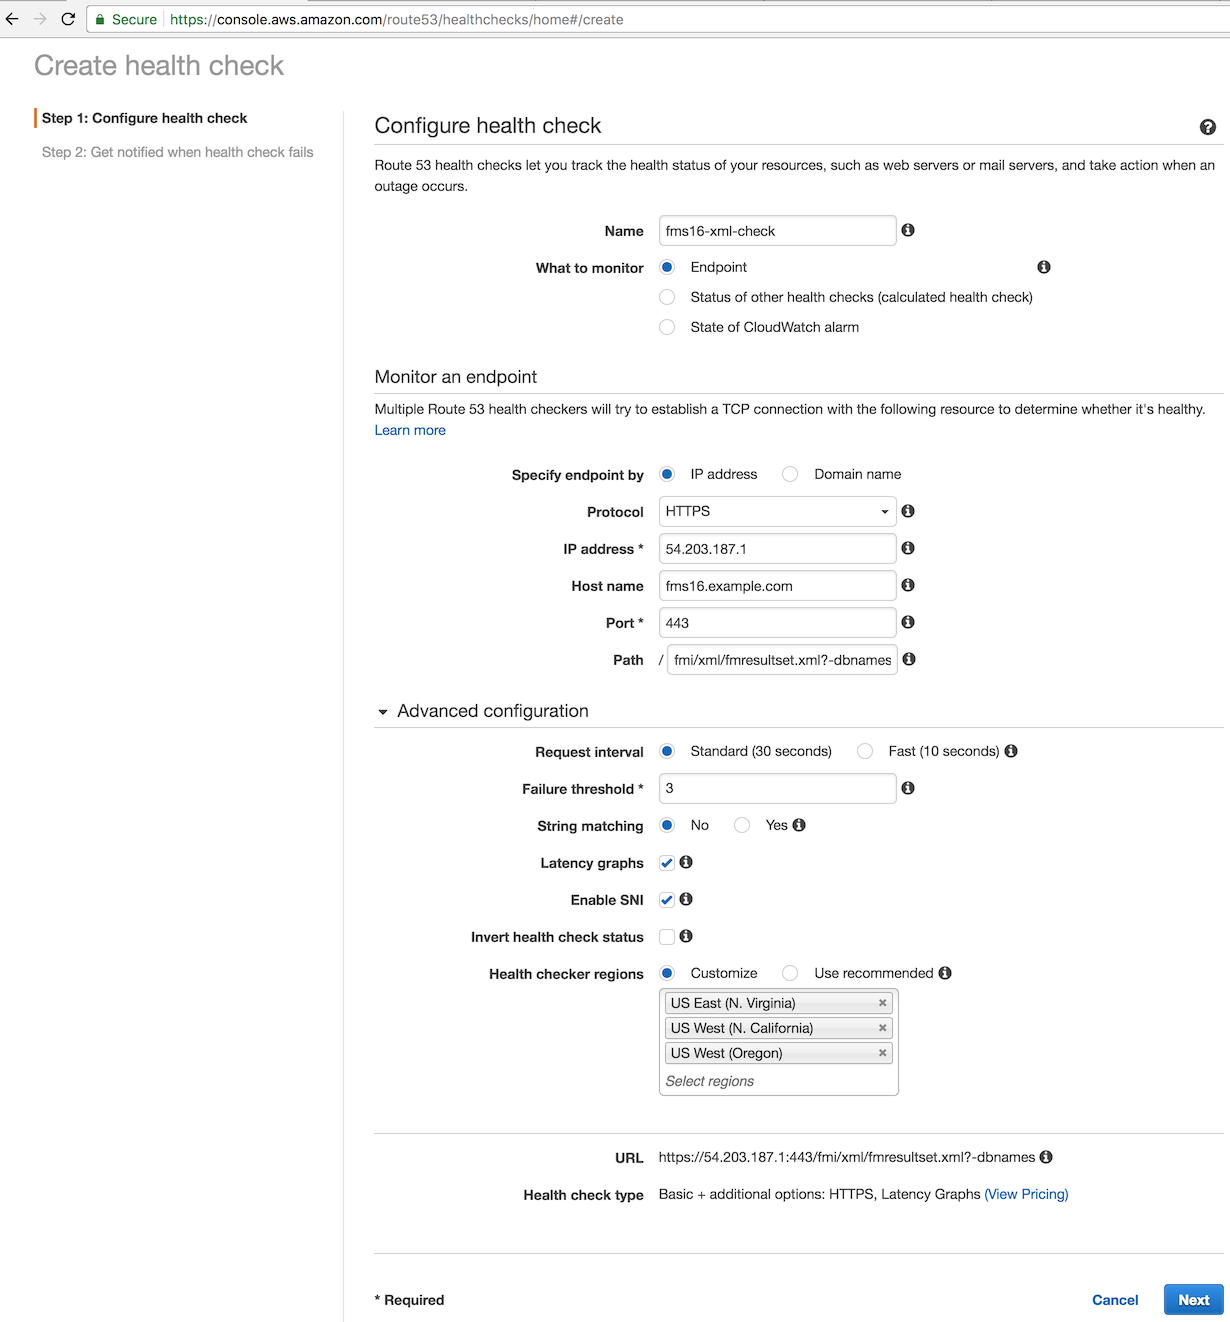
As you can see below, the configuration is mostly straightforward. A number of them can be left at their defaults, but you might decide to better tailor your checks to the system being monitored. For instance, you could check if a specific file name is returned as the result, or perhaps just check if port 5003 is open.
You’ll notice though that I used a particular path however. This is one of the few queries that will work without first authenticating to the server, which we have no way of doing with this interface. Also, the Domain Name based checks don’t make sense for this usage, so you’ll need to use the IP address based check. You can supply a hostname, but it is merely a parameter, and has no bearing on what server is checked.
And finally, if your are interested in later graphing latency values, this appears to be your only chance to enable them. You’ll need to disclose the Advanced configuration options to see this. I couldn’t find a way to enable latency graphing after the Health Check had been created.
After clicking Next, on this screen we can either use a pre-existing “Topic”, or create a new one. Here I’ve created a new one, so it is also asking for the email addresses to be emailed any alerts.
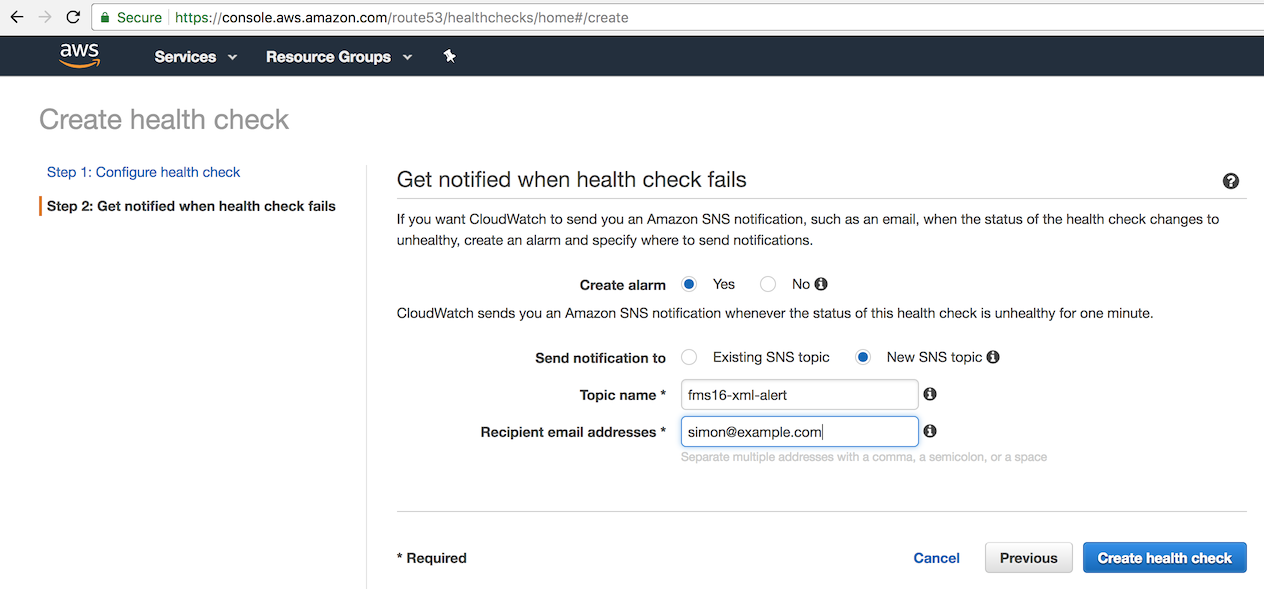
Now that your alert is set up, if the XML interface returns 401 or 501 errors, or the health check can’t connect to the server you’ll get an email notification.
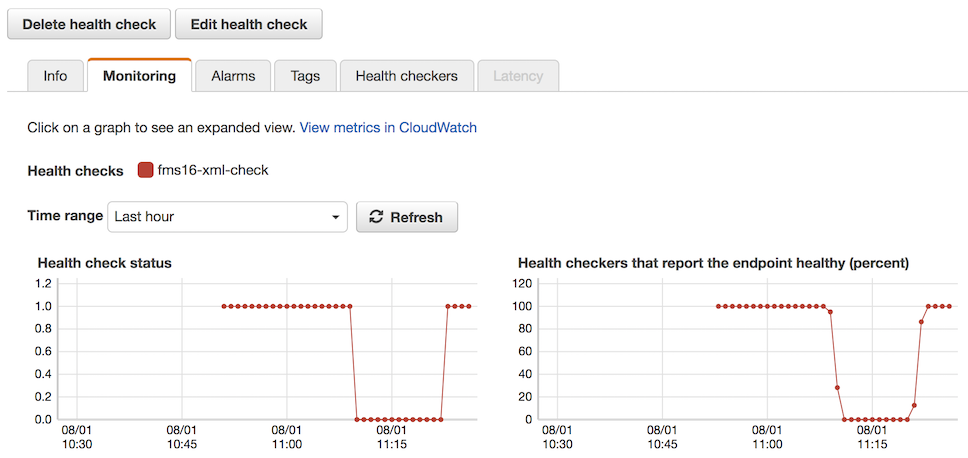
Without any extra work, you can also go to the Monitoring tab and see the Health Check’s history.
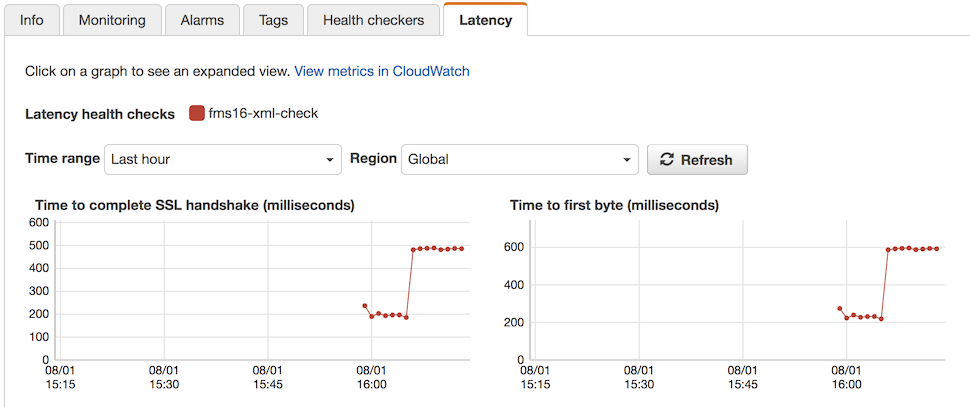
If you have latency metrics enabled, you can also use the built-in latency graph. In the example below, I added in some non-US based health checkers, resulting in longer latency times being graphed.
Simon
- Although there are some technical reasons for this, it still seems a bit odd, especially since the AWS CloudWatch service is used for part of this functionality.