FileMaker supports bidirectional communication between a web viewer and data or scripts. So, you may find yourself doing more development using plenty of web code and JavaScript integrations.
If you’re having difficulty getting your HTML, CSS, or JavaScript to render in a FileMaker web viewer, there’s a great way to help inspect and fix it. You just need to know the hidden option to enable WebKit debugging in FileMaker web viewers.
Most web browsers have facilities to help developers find problems in their code. Safari is no exception, with built-in debugging tools as part of its WebKit browser engine. It turns out if you are using macOS you can get the same facilities found in Safari to also debug your code that’s running in a FileMaker web viewer.
I’ll show you how to enable WebKit debugging for FileMaker web viewers, and as a bonus, point out JavaScript Debugger Extensions that you may find very useful now, for FileMaker development.
Enabling Web Inspector
To do this we need to first enable a hidden option. Quit any open copies of FileMaker and start up the Terminal app to execute one or more versions of the command below.
Quit FileMaker if open, otherwise it will overwite the plist change that we’re about to make to enable WebKit debugging.
For FileMaker Pro 19, type or paste this into the terminal. And…yes, pro12 is the correct parameter, even for version 19:
defaults write com.filemaker.client.pro12 WebKitDebugDeveloperExtrasEnabled -bool YES
For FileMaker Pro 18 and older, check out this blog post.
Debugging Using Web Inspector
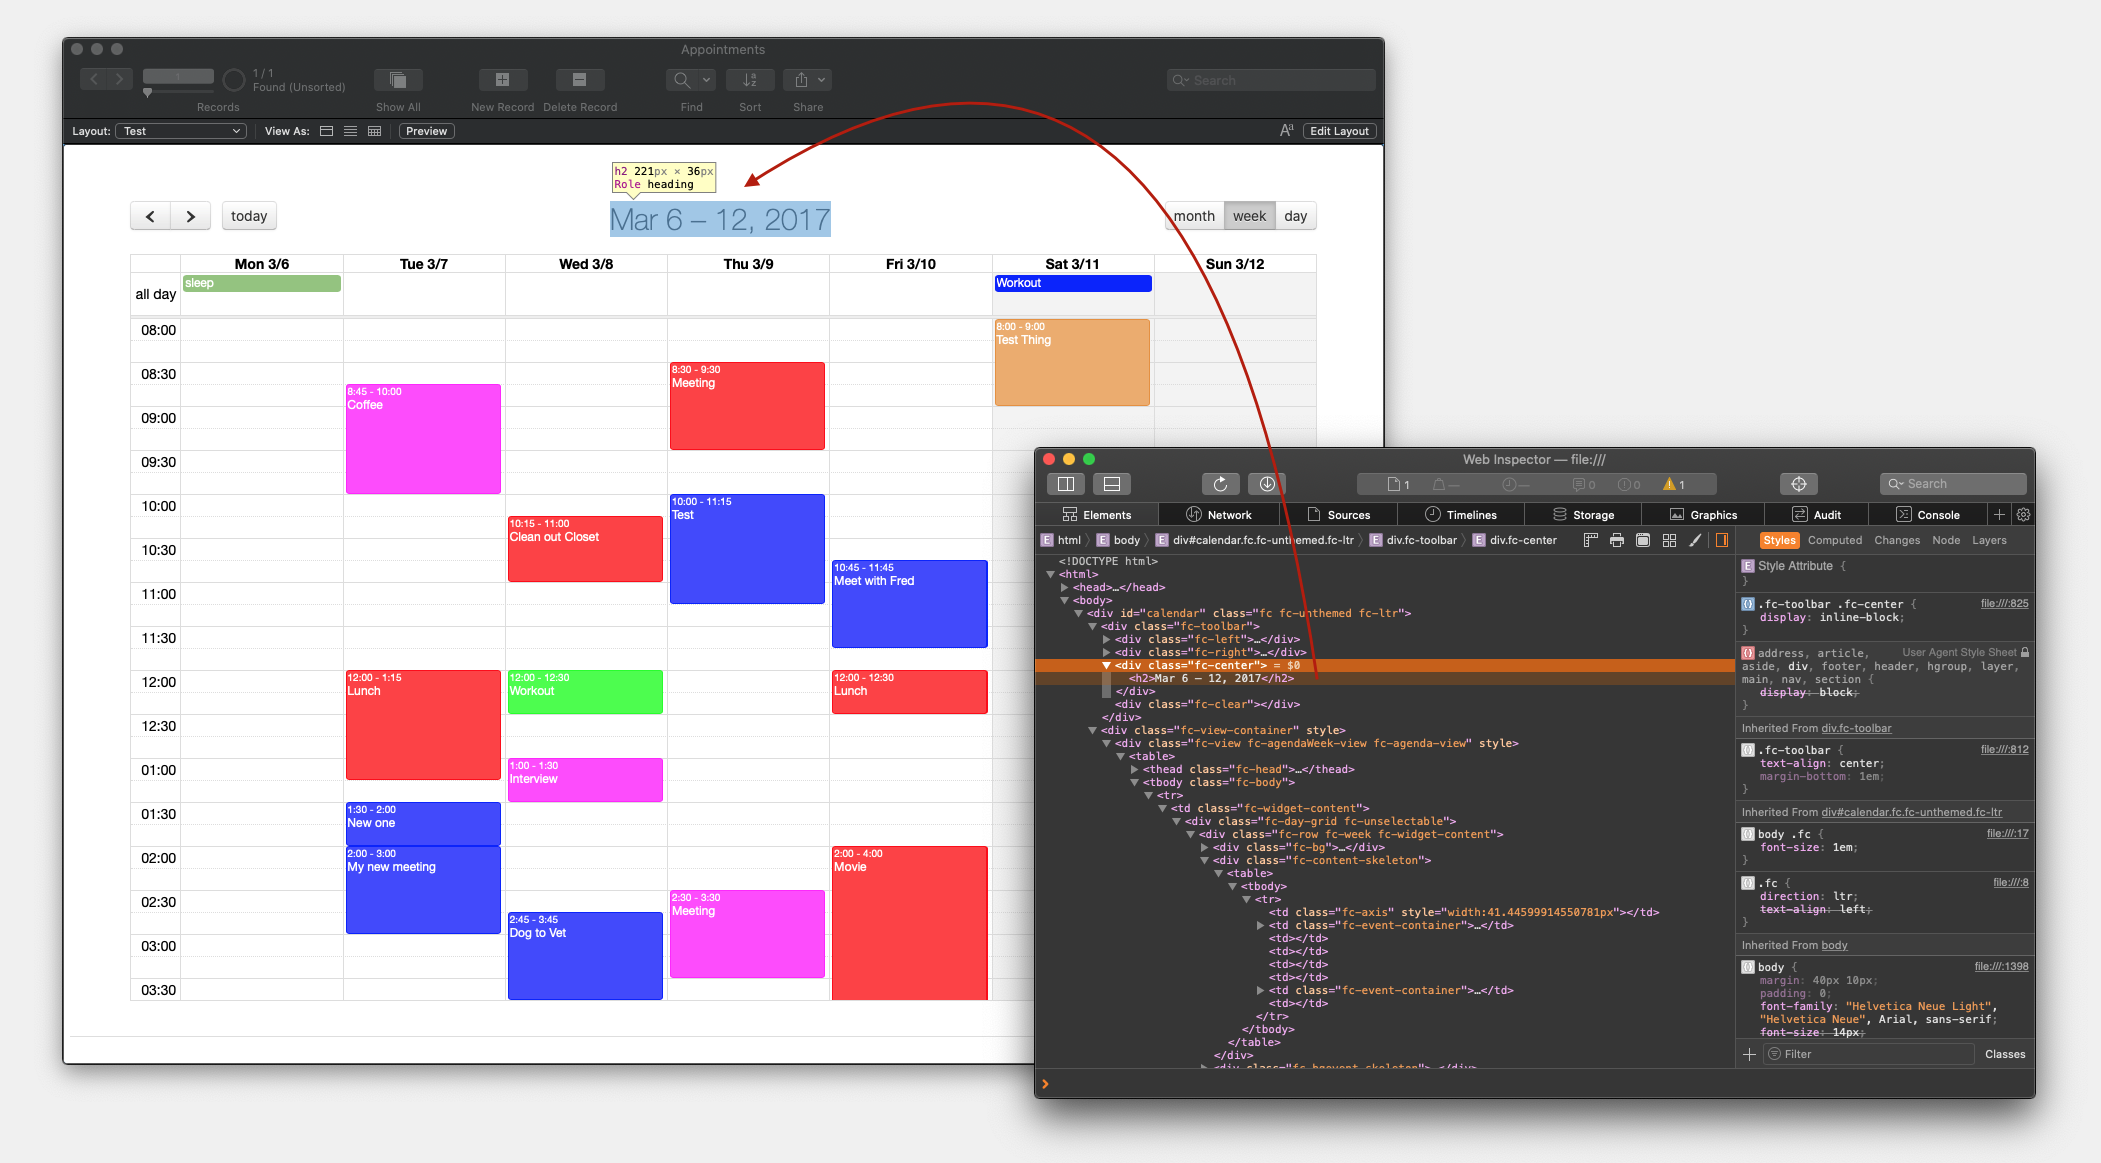
With your plist changes made, start FileMaker Pro back up, and navigate to a layout containing a web viewer. Make sure that Allow interaction with web viewer content is enabled. Now, back in Browse mode, right-click on a Web View, and select Inspect Element from the contextual menu.
Voila! You can now debug HTML, CSS, and JavaScript in any FileMaker web viewer.
JavaScript Debugger Extensions
If you are debugging JavaScript and are trying to catch your code in action, there are some minor tricks required.
One issue is that the debugger will go away whenever the Web Viewer is not displayed. Annoyingly, this also clears any previously set breakpoints.
So, for debugging JavaScript code you probably want to take advantage of the debugger extensions added to JavaScript. These are documented on table 5-2 of the Safari Inspector Guide.
A partial list of functions are:
- console.assert(expression, object)
- console.log(object)
- console.profile([title])
- console.trace()
- debug (expression)
- debugger
None of these debugger functions will work until the Web Inspector has been activated, so enable it as soon as possible with the contextual menu on the web viewer. But at least the debugger breakpoints will persist each time the web viewer is reloaded.
I hope you find this helpful in how to start using WebKit and JavaScript debugging with FileMaker web viewers. And I especially hope you’ll enjoy working with the nearly unlimited possibilities that JavaScript offers the FileMaker platform.
– Simon
References
One thought on “How to enable WebKit and JavaScript debugging in FileMaker Web Viewers”