[Update!] FileMaker has just announced FileMaker 16 and you can learn a little bit about what is new here. We also have a new post on how to tightly integrate FileMaker and Tableau together called FileMaker 16 & Tableau | A Match Made in Data Heaven! There are many exciting things about what is possible with FileMaker 16, but one of the most exciting things I think is the integration with Tableau. Many more blog posts to follow on this subject. So just wanted to mention in this post that this technique will also work with FileMaker 16.
I’ve been a long-time fan of visualization, going all the way back to the Stanford research project, Protovis. I still consider myself a novice when it comes to what is possible with data visualization. The first time I got the InspectorPro script universe working, I saw a wealth of information. But others viewing it wondered how they could make practical use of it — they wanted something more interactive. I think ultimately a dashboard, for it to be truly useful, should have some level of interactivity. You can do more with data you can play with. So when I first heard about Tableau a number of years ago I was intrigued, and when they finally came out with a Mac version I was hooked!
FileMaker, a popular tool used by small to medium size workgroups, is a great platform for data gathering, curation, and sharing. It offers a great deal of flexibility and FileMaker, Inc. is continually investing in keeping the application modern (you can check out the roadmap here). As a rapid application development tool with an approachable scripting language, there is no other tool that comes close – and Tableau is FileMaker’s creative and visual cousin!
For a long time, the only way for Tableau to get access to FileMaker data has been to export your data to Excel and then import it into Tableau (on FileMaker’s roadmap for the next release, however, is the “Tableau Web Data Connector”). We’ll do a follow up post once the next release is out and go into more details then, but for now it’s Excel, so let’s look at how to integrate FileMaker and Tableau today. Here is a simple example to get you thinking about the possibilities.
If you want to start with an empty Tableau file, then checkout this video, if not, skip down to the steps below.
The example file is called Superstore.fmp12 and I have imported the example file that is often used with Tableau examples.
Start by downloading these three files:
Excel file: superstore_data.xlsx
Password: tableau
• Show all records
• Export your data in Excel format
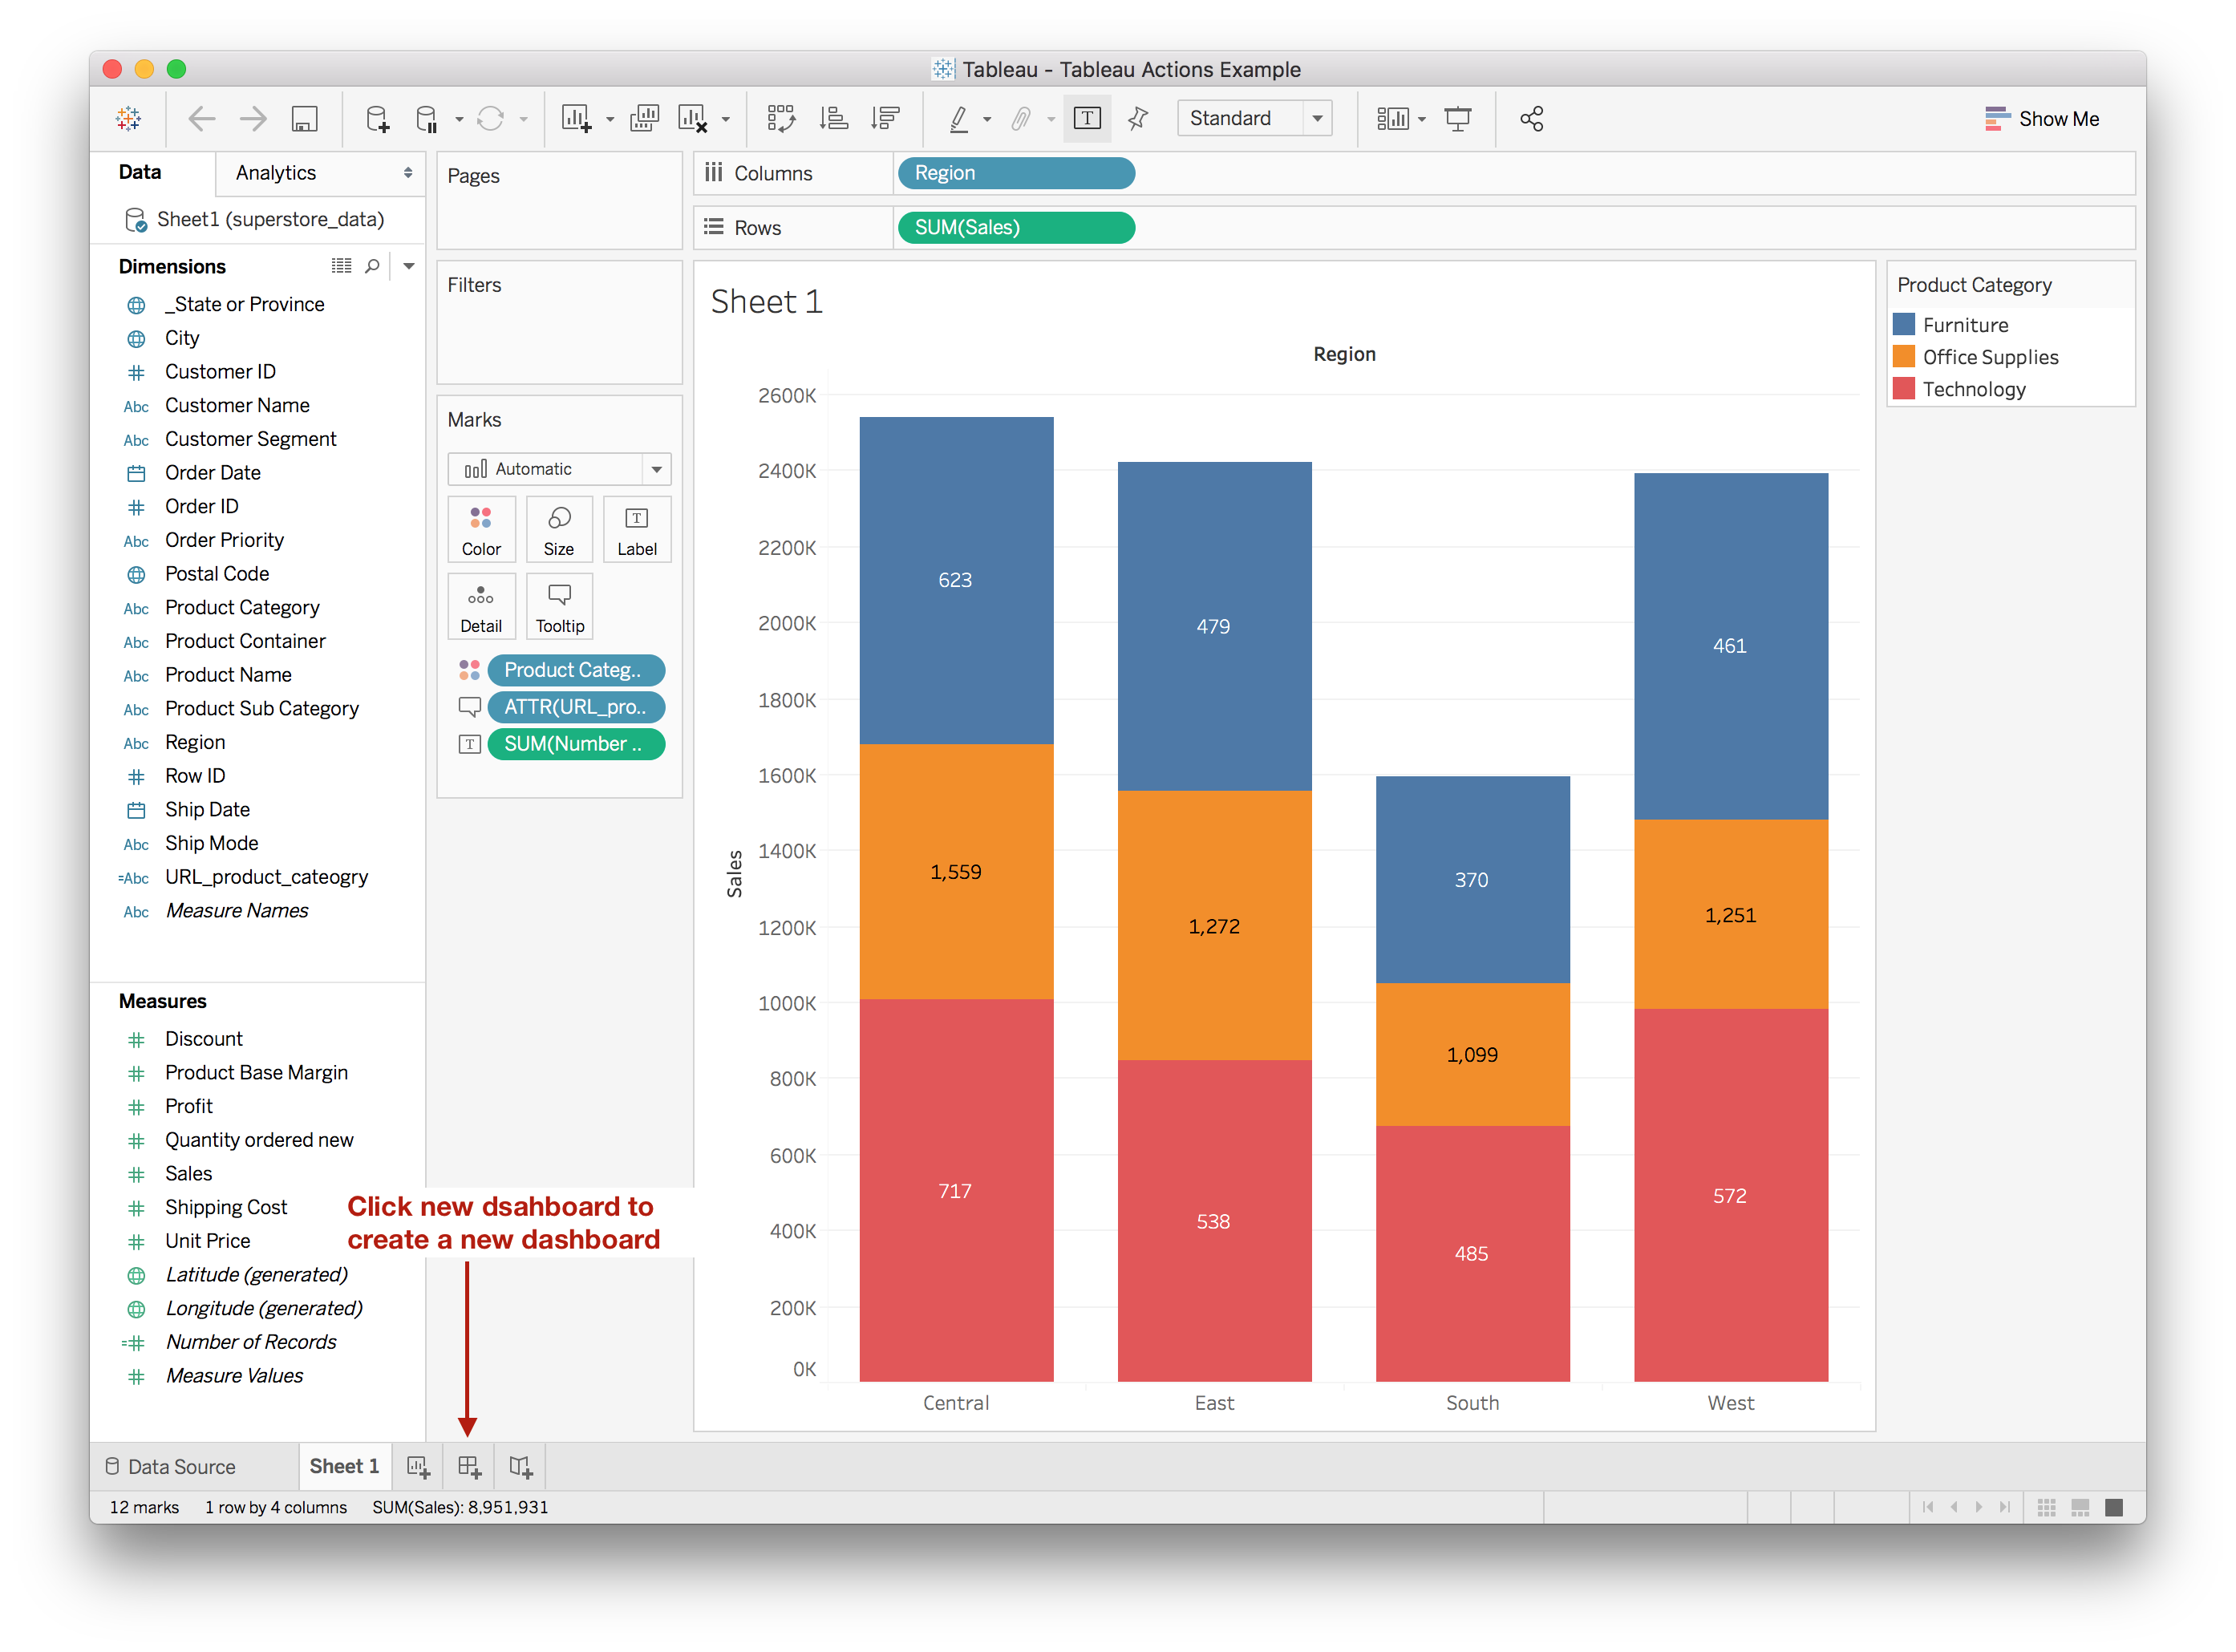
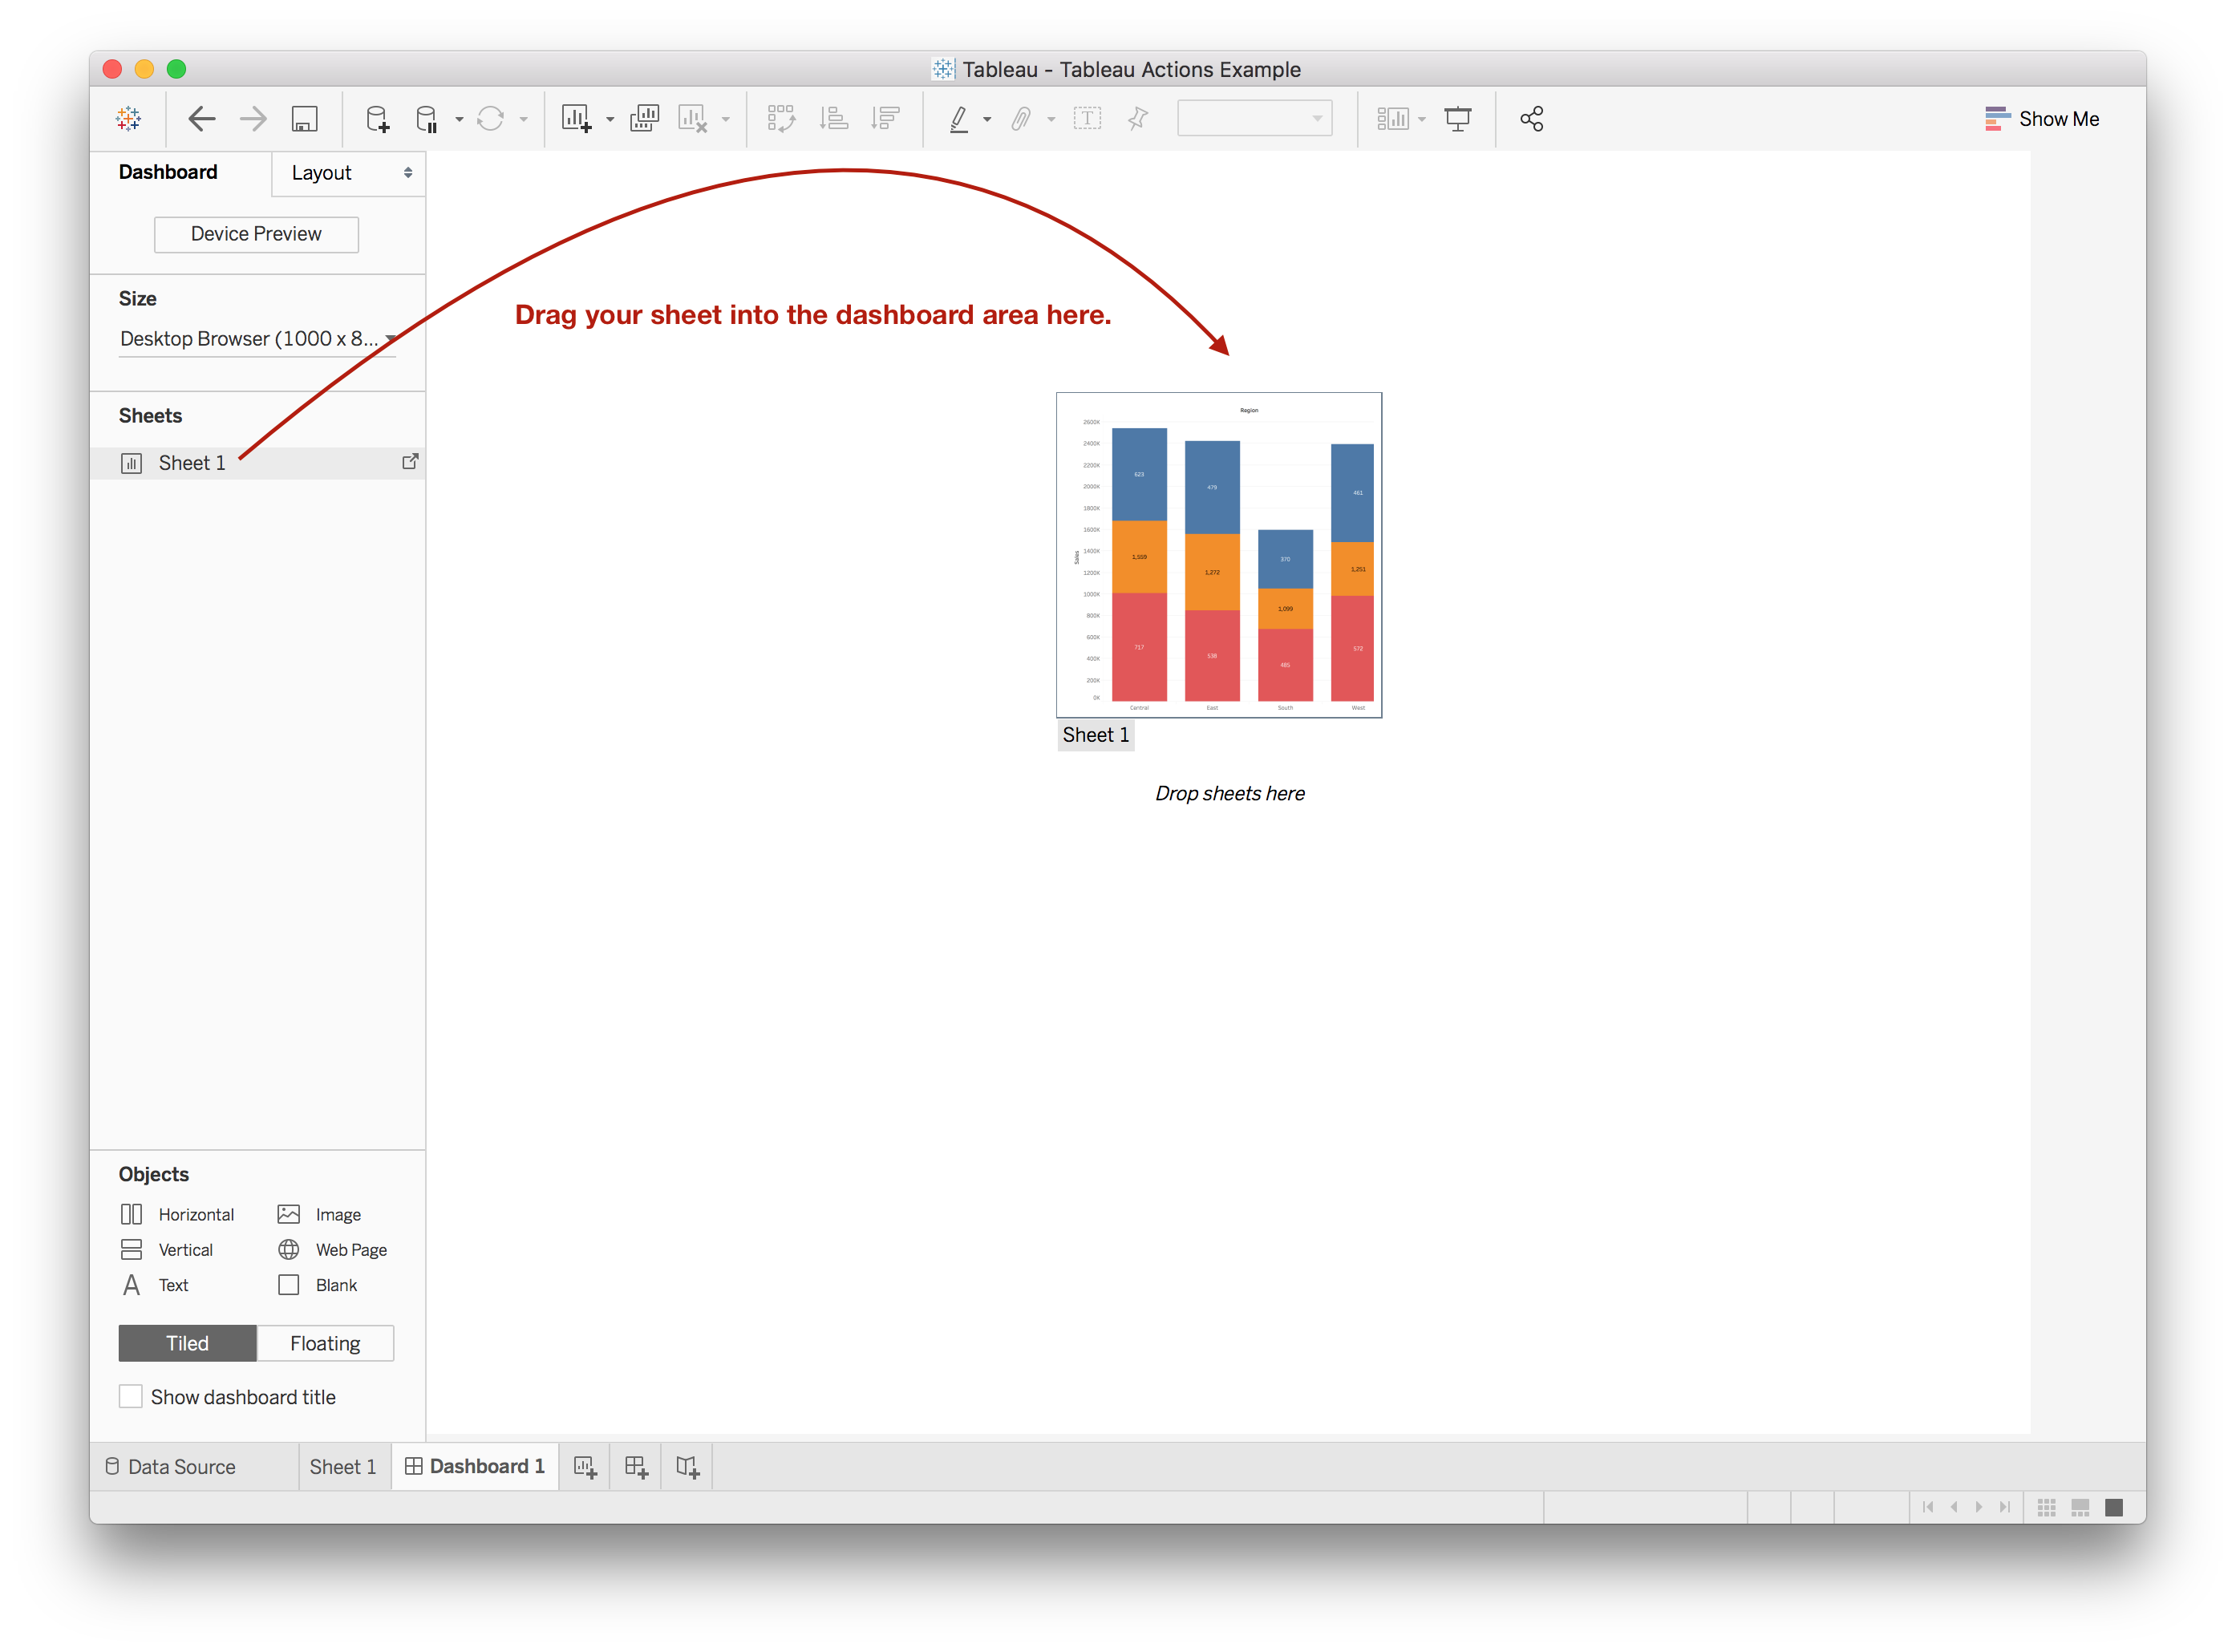
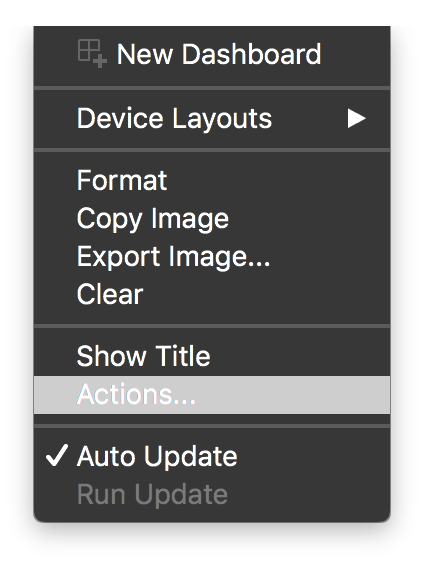
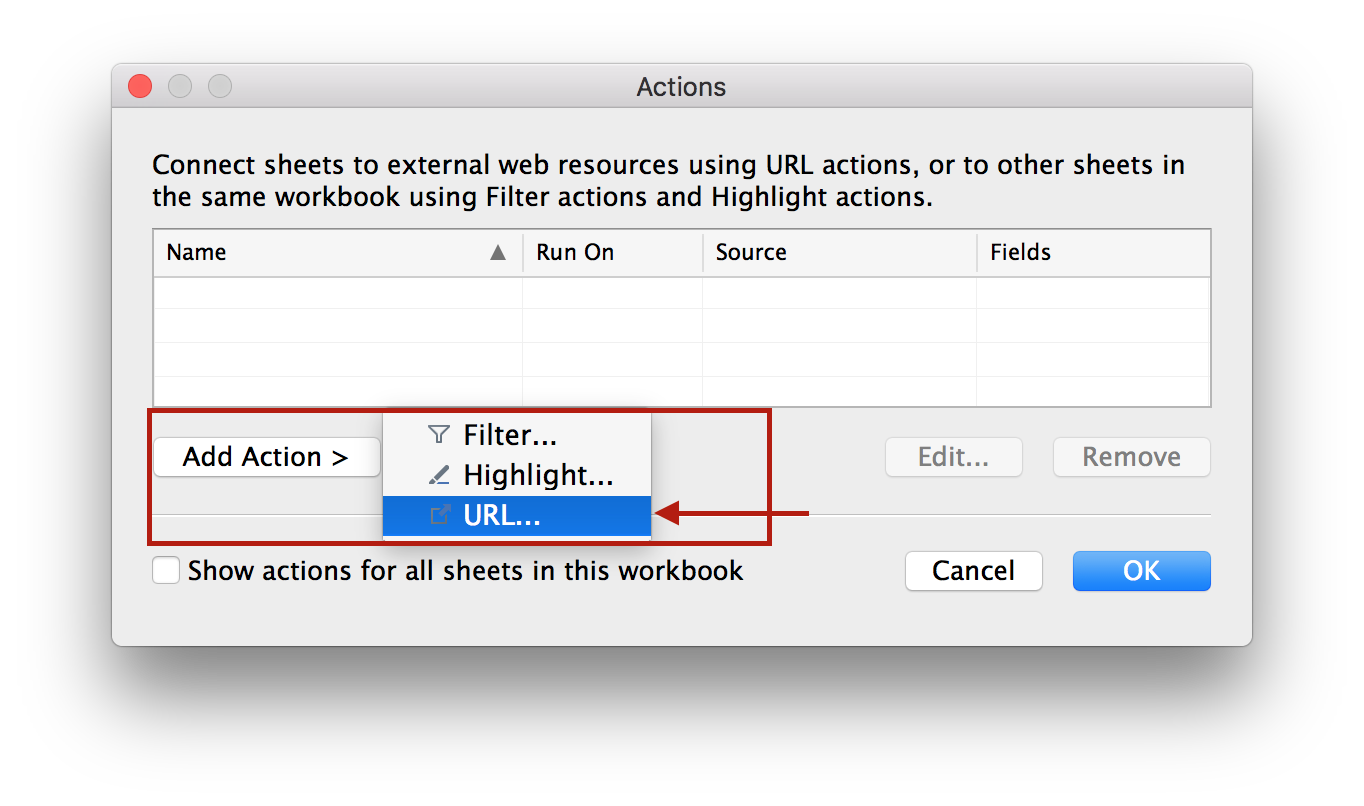
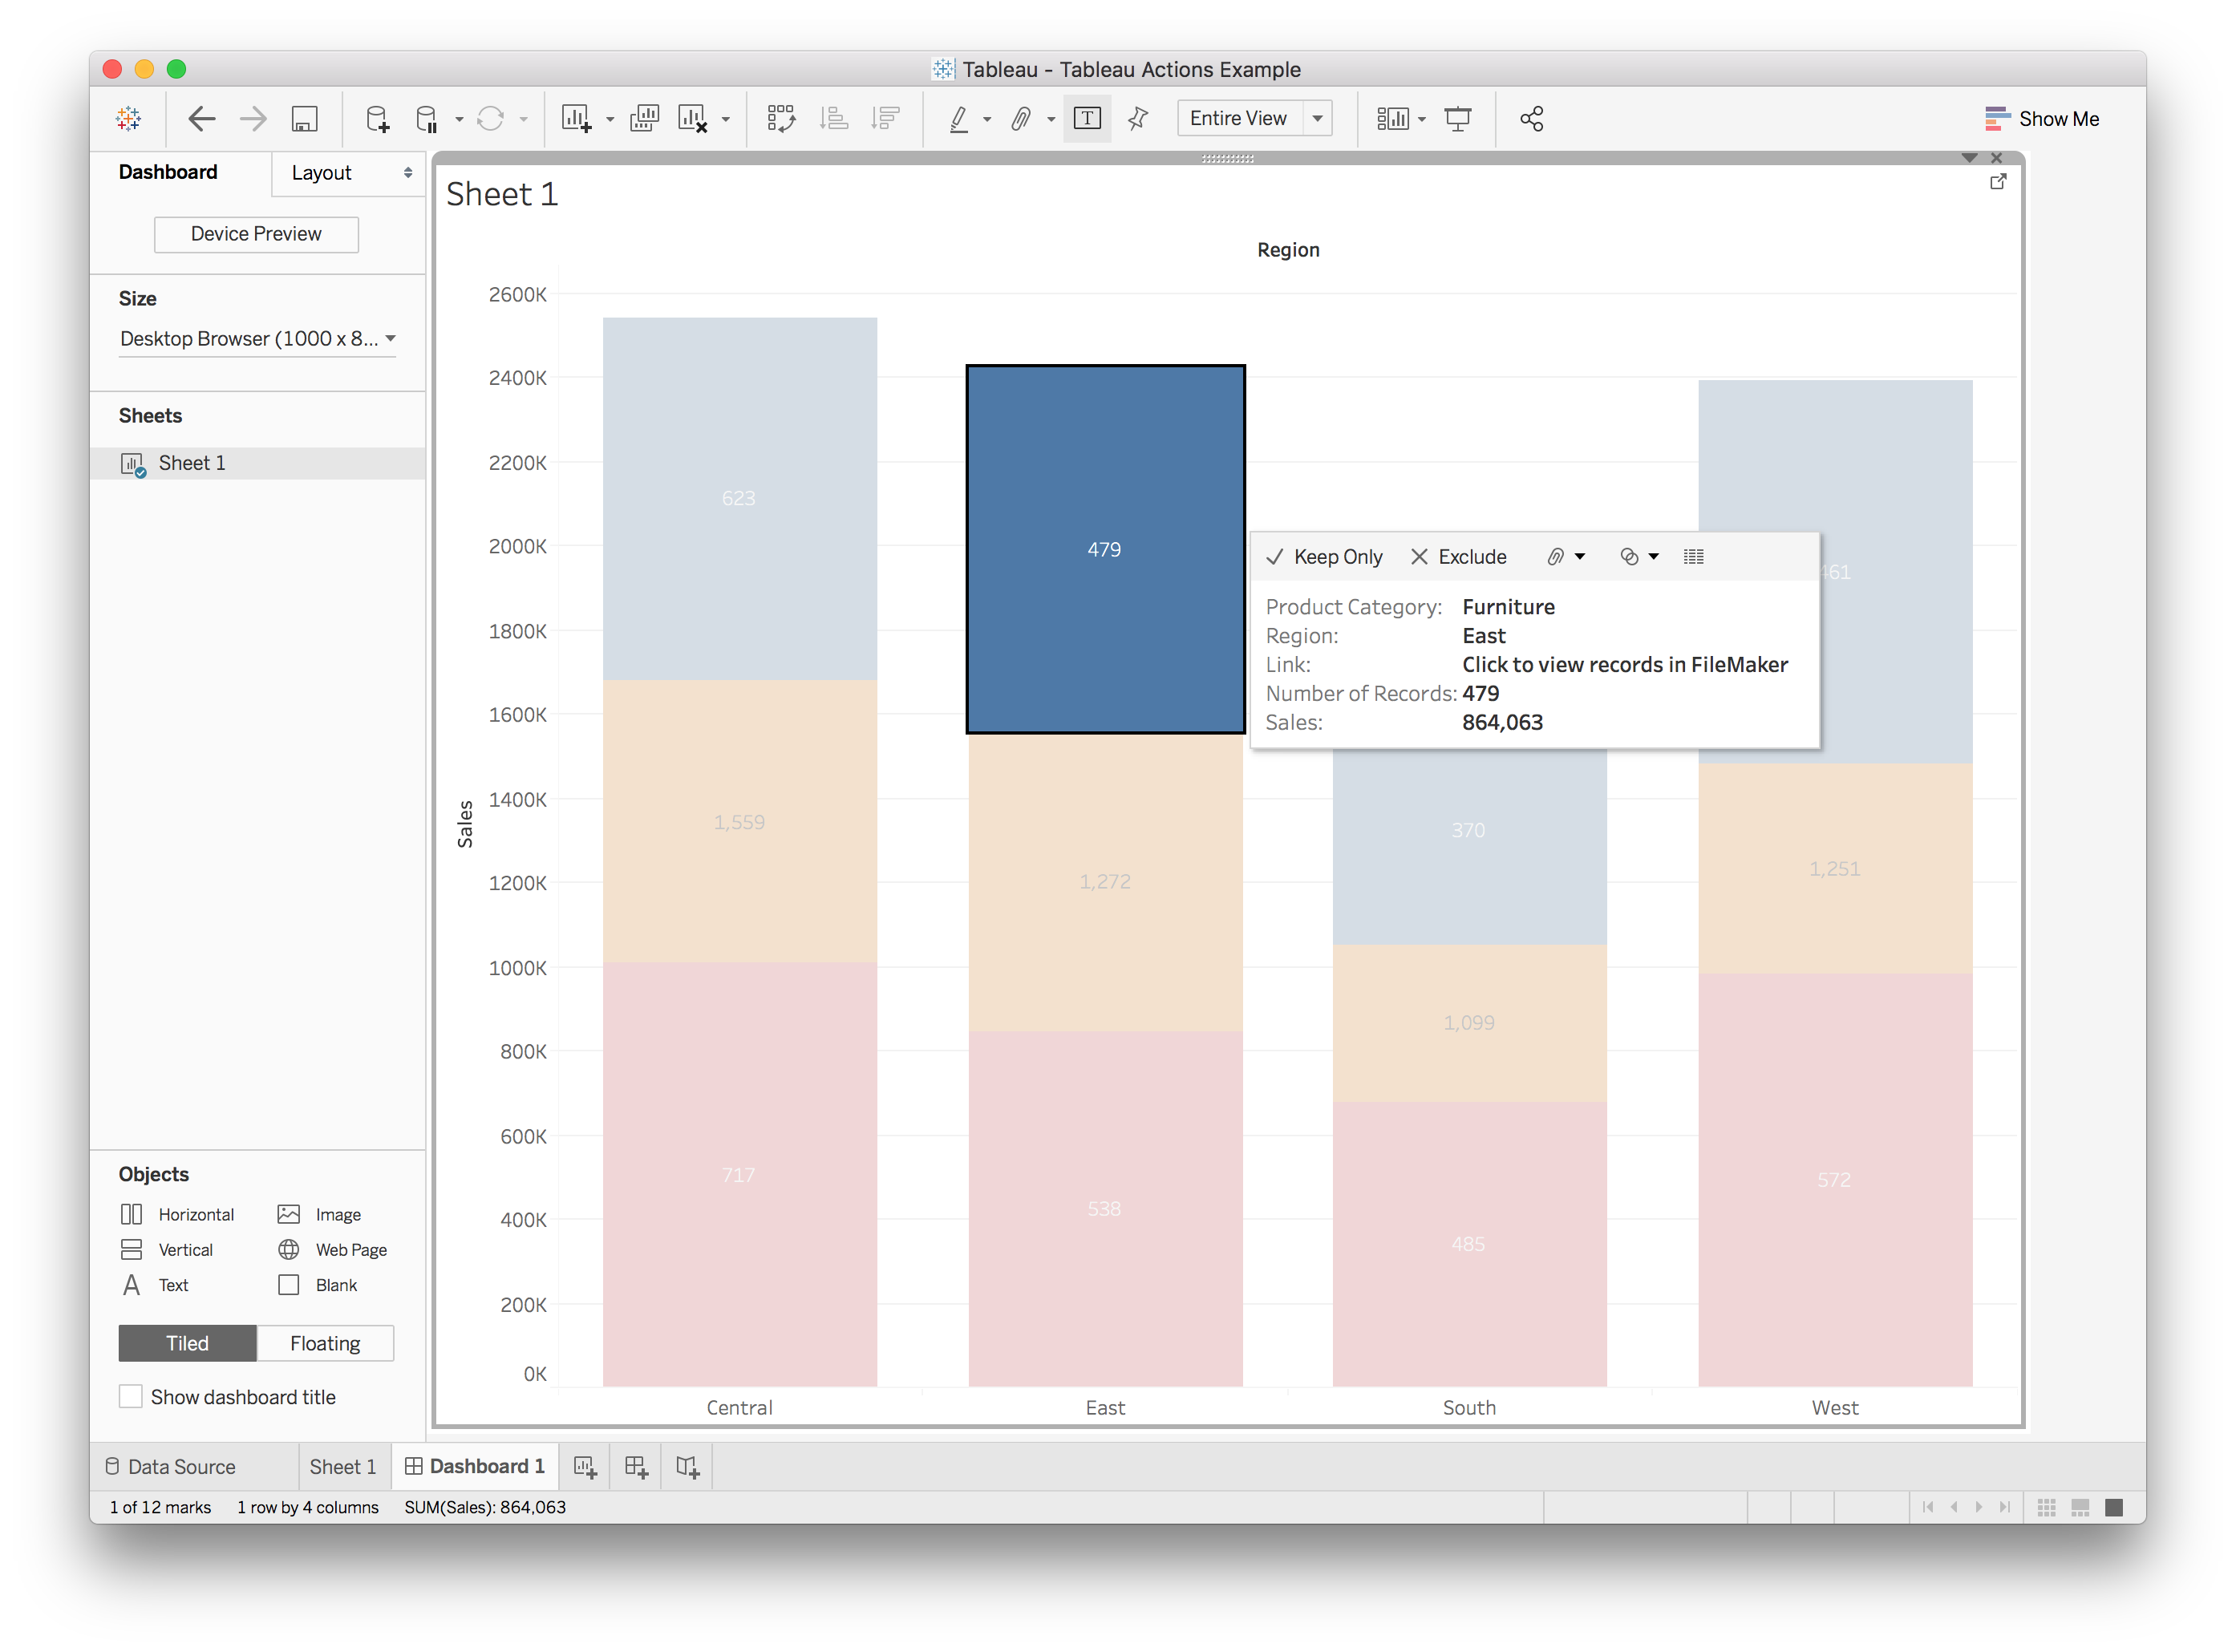
What is outlined next here are the steps to create your dashboard, and the worksheet and then adding in the fmp url as an action when clicking on a segment.
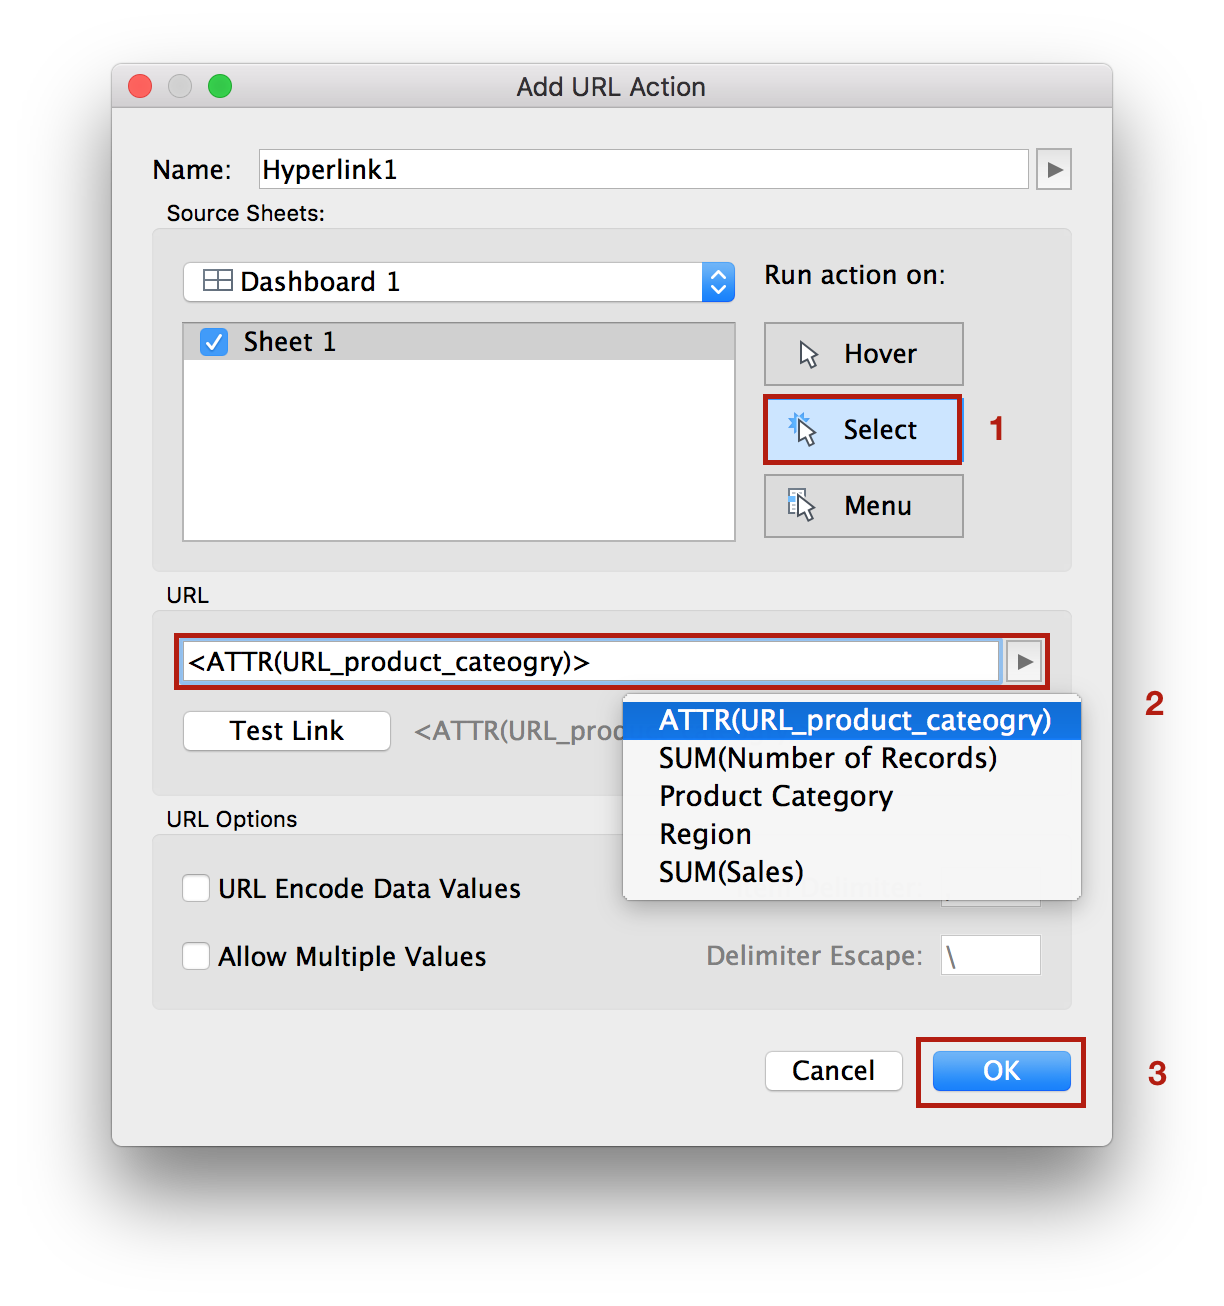
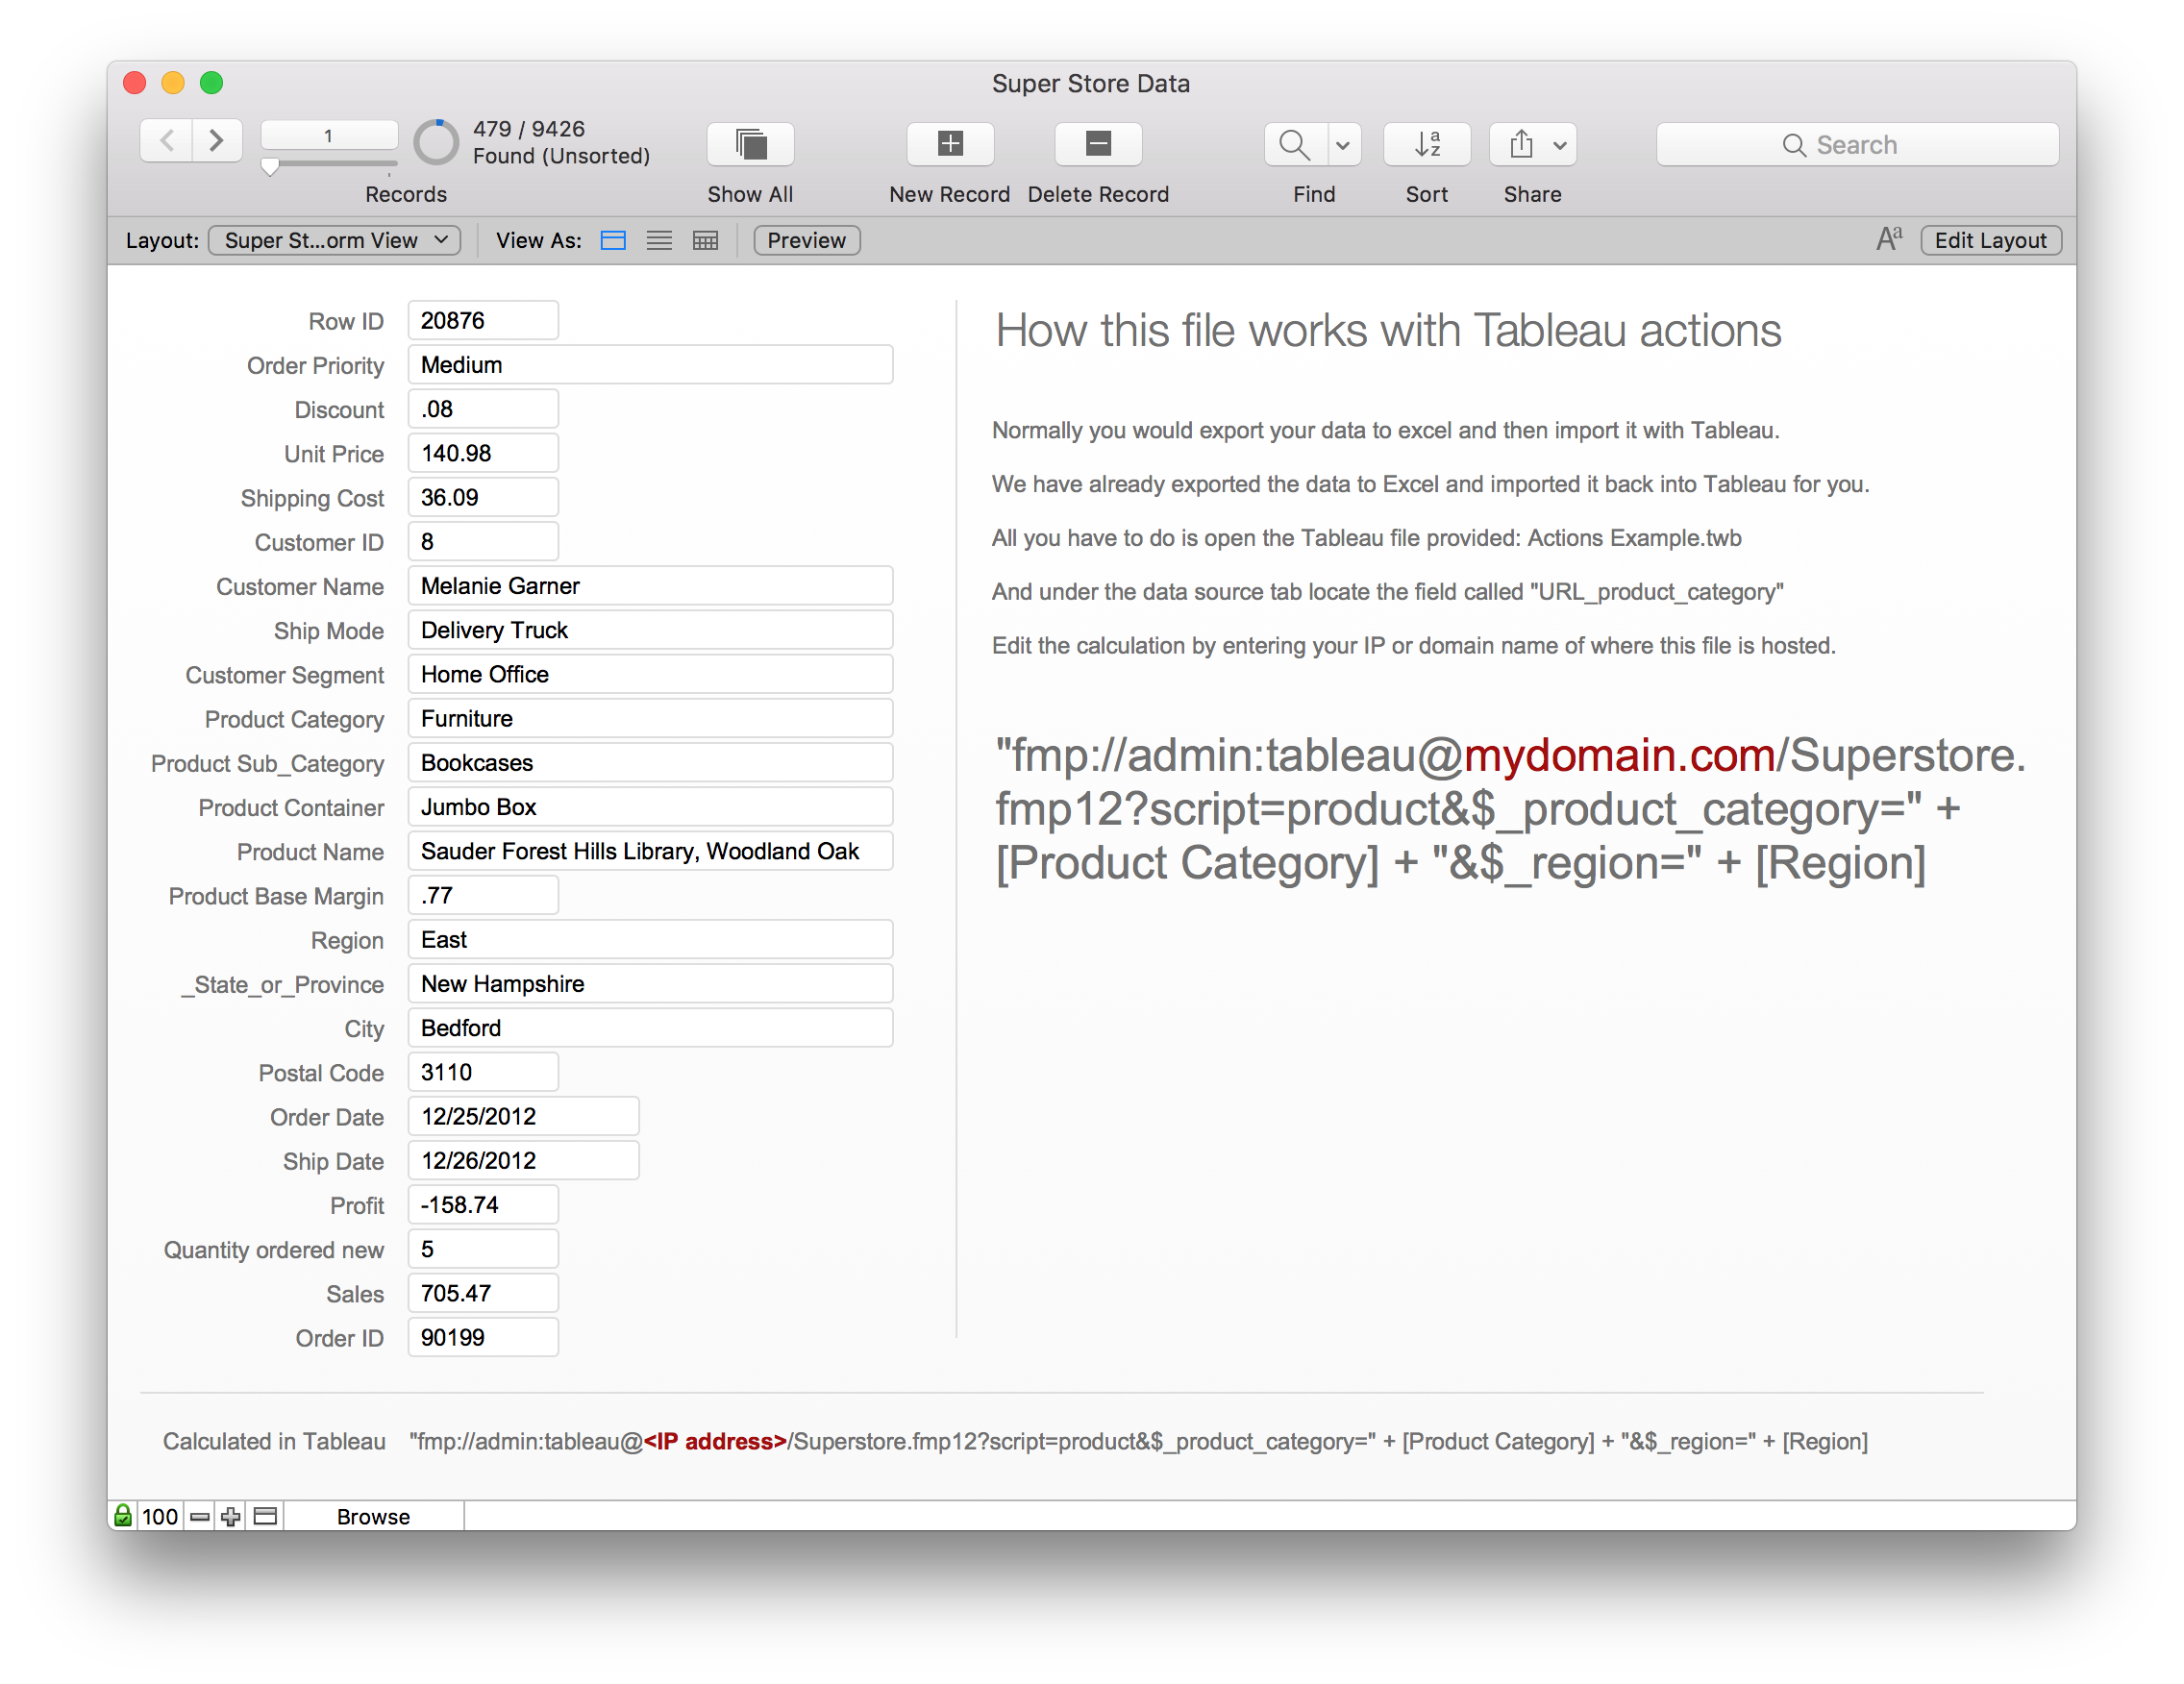
Troubleshooting. If it doesn’t work, make sure you didn’t forgot to update the URL_product_category calculation to include your IP address/domain name.
The calculation looks like this:
“fmp://admin:tableau@myDomainName/Superstore.fmp12?script=product&$_product_category=” + [Product Category] + “&$_region=” + [Region]
As you can see, we can already integrate FileMaker and Tableau to do some wonderful things. Considering FileMaker’s announcement of their forthcoming Web Data Connector that aims to “provide integration with Tableau Desktop using the FileMaker Data API to better visualize FileMaker data,” it is safe to say that the future looks really great for both tools.
2 thoughts on “FileMaker & Tableau | Building Dashboards with Interactivity”