Hello again from Tableau Conference 2019 in sunny Las Vegas! Here at Beezwax, we had 5 attendees this year with a diverse set of sessions between us. I wanted to give a rundown of what I went through and some of my takeaways.
How to “Excel” with Tableau
This session was primarily a more basic lecture regarding importing Excel into Tableau and the ways in which you can interpret the data to get the information that you need. The example was fun based on data regarding Bigfoot sightings and the desire to see Bigfoot. Slicing and dicing the data, we were able to see sightings by state, per capita sightings, sightings by county, trending and forecast data with time of year, and word clouds based on descriptions.
Excel is a popular tool that many of us use on a daily basis, but in the end, that’s just raw data. Following my post from yesterday, it’s up to you to take that data and determine what you’re trying to interpret from it.
Lies, Distortions, and Misrepresentations in Visualization
This was a very fascinating lecture on how we can take data and dictate the narrative in disingenuous ways — whether purposefully or accidentally. We looked specifically at bar charts, maps, and histograms and the biases that can occur as a result. Great new terminology, some book recommendations, and academic papers (I love academic papers) to add to the toolbox.
Biggest thing: When you’re looking at a viz and have a “wow” moment, that’s not the conclusion of your research — this is only the beginning.
Shoot the Moon! Small Steps and Giant Leaps Towards a Modern Culture of Data
Very interesting talk where we went over several micro case studies and the fundamentals on how to tie data with business practices. The possibilities are endless here, and we should all strive to make our businesses more data-driven in an accurate and responsible way.
From Degas to Dashboards: Lessons of the Great Masters
Tableau can create some beautiful dashboards, and there’s so much we can learn from some of the greatest artists in the past. We went through lessons on how to create vizzes with inspiration from impressionists, cubists, pointalists… all quite fascinating and can stretch how design can be applied to Tableau. Lots of great resources to use in the future as well.
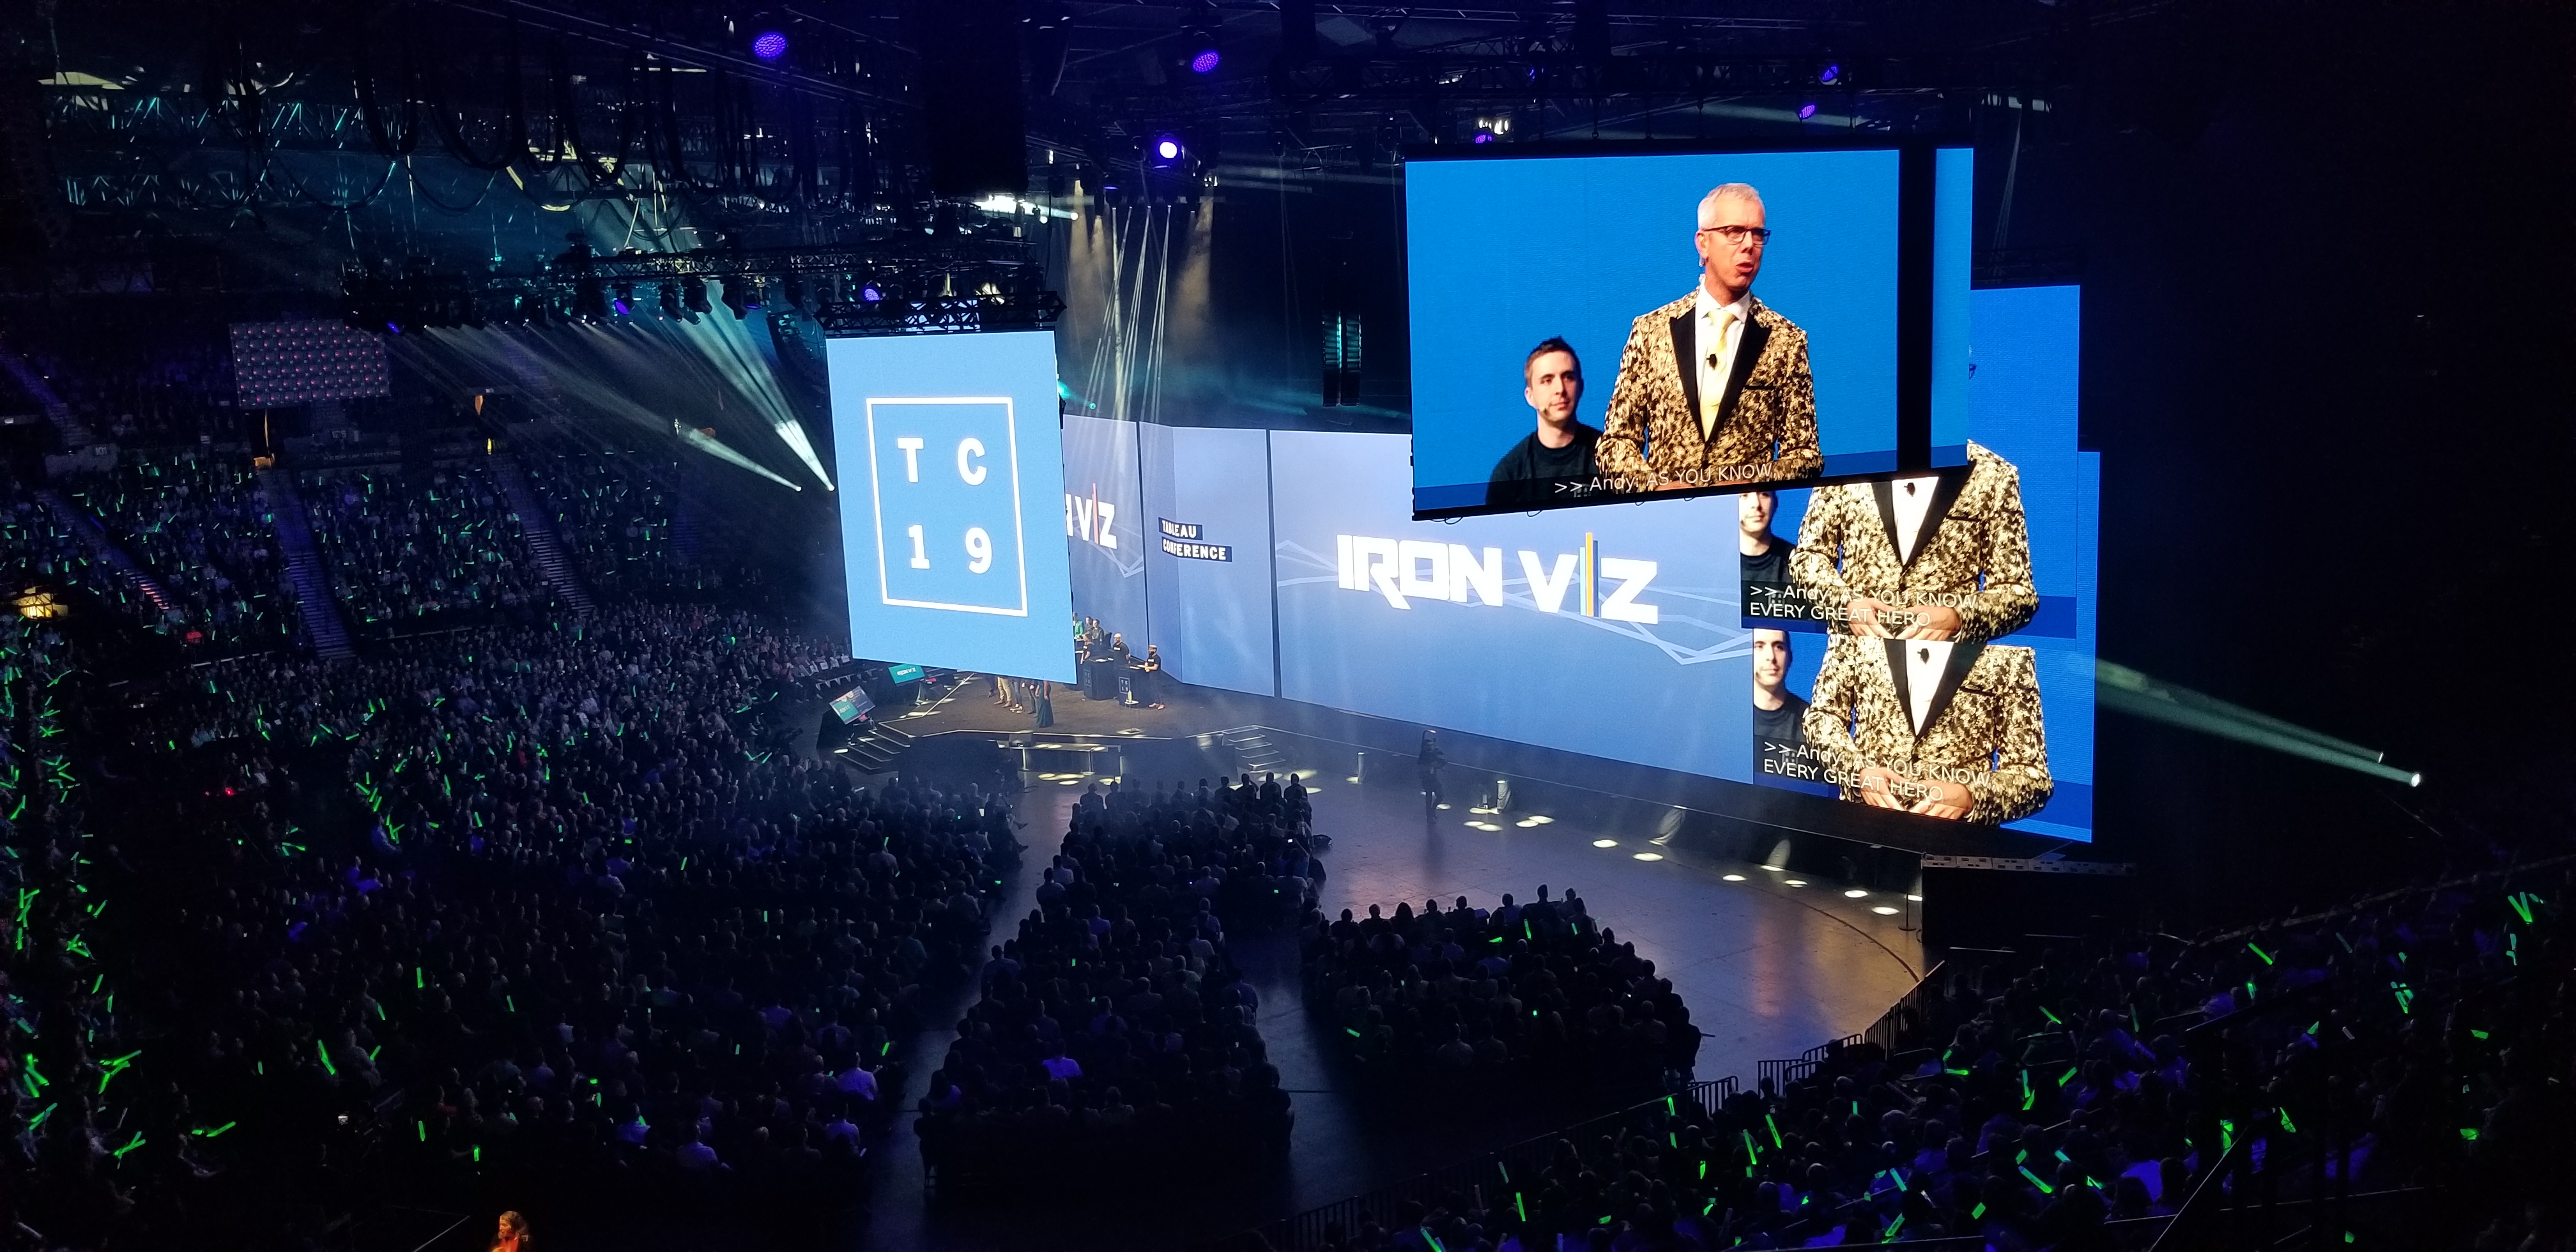
Iron Viz 2019
While not a seminar, this was recently fun to watch! Tableau put together a competition where three viz masters compete to see who can put together the best viz in 20 minutes live. The results were very impressive, and the production was outstanding. The vizzes should be available soon (if not now) on the Tableau Public site. All three were winners in my book.
Can’t wait to see what we have for tomorrow!
One thought on “Day 2 Sessions | Tableau Conference 2019”