To describe this next technique I came up with my own acronym, and I call it "NoSSR", which stands for Not Only Sub-Summary Reports. The goal of this blog post is to show you a way to build and deliver similar results but in a statically defined way. Another way to put it is to architect for performance, so let’s see what can be possible. This post also assumes you know how to build a FileMaker sub-summary report layout already.
Quickly, I have to explain the title of this post — you have probably heard of the term "NoSQL". For the longest time I thought that NoSQL was literally “No SQL” but at some point I read somewhere that NoSQL stood for "Not Only SQL" and SQL being the Search and Query Language. Thus, "Not Only Sub-Summary Reports" was born.
Getting Started
First we’ll need some data. I used sample data from data.gov. Downloaded baby names since 1910 for each state in the US.
Download Sample File here … NoSSR
As part of the download I have included all the files if you want to look them over, however I have already imported all the files into my example database so the baby names table has 5,552,452 records in it. The columns in the excel files are STATE, GENDER, YEAR, NAME, OCCURRENCES. So each excel file represents unique names in each state and the number of occurrences of that name. Lets say we wanted to see what the percentage of unique male names vs unique female names there was in any time period or any state or for that matter for the entire country. The first thing I did was build the report as you would in FileMaker. I created a new layout and added a sub-smmary part by gender.
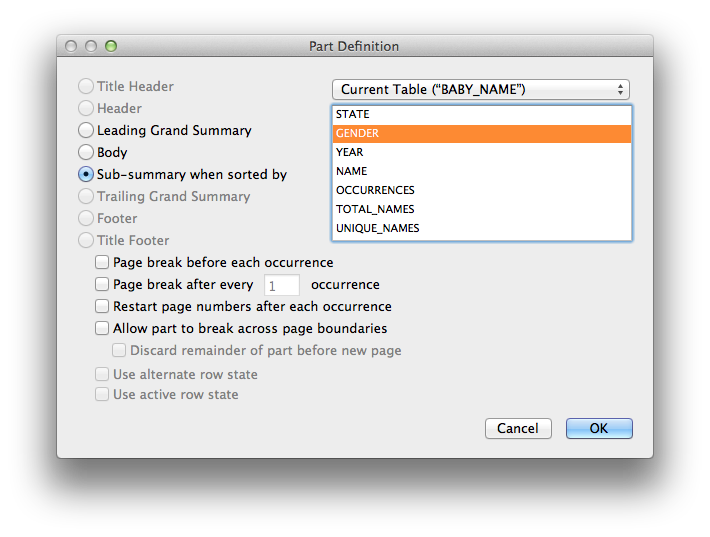
We’ll add some sub-summary fields to get total of all names in the reporting period/state, and another sub-smmary field for the count of occurrences of each name. Because the excel file is a sinlge name with the number of occurrences of that name then all we have to do is count how many records for each sub-summary part. The last calculation is to get the percentage of the whole does each gender represent. And for that we used a calculation field referencing the sub-summary fields. GetSummary ( UNIQUE_NAMES ; GENDER ) / GetSummary ( UNIQUE_NAMES ; UNIQUE_NAMES ). So lets say we wanted to see this report for California in 1910. I would look something like this.
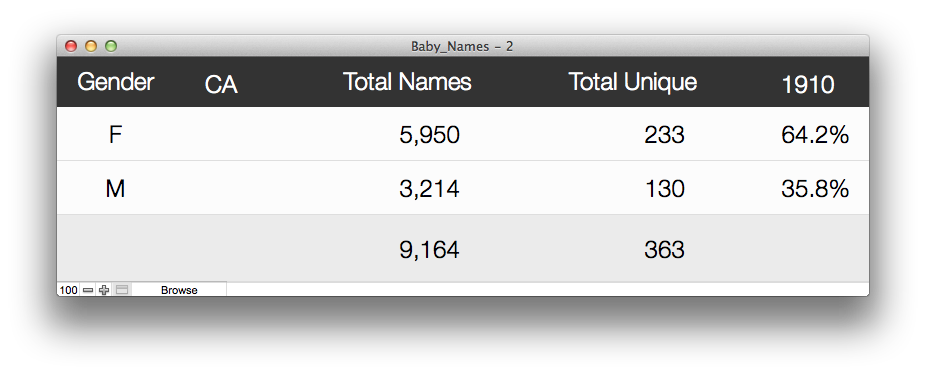
There are only 363 records in that found set so not a big deal to go fetch that data and show the results. If you are a WAN user however even showing as few as 363 records may cause some of the progress dialogs to come up and become visible while it is summarizing the values. Before we look at the script that generated the static sub-summary report lets look at the final output. Not bad … mind you I did spend a little more time on making this one a little prettier.
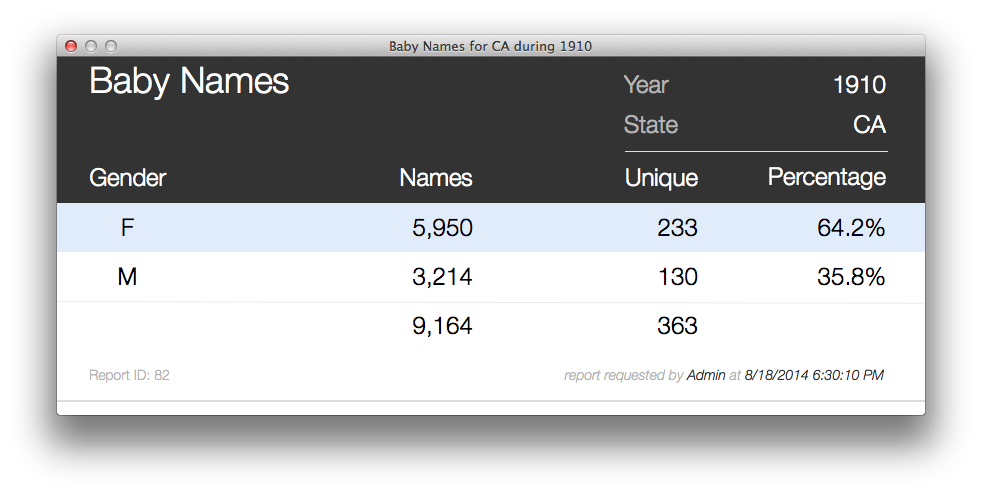
The important thing to note here is that the results are identical.
We are working with totals for each year. Those numbers are not going to change so if someone requests data for a particular year and state, instead of performing a search and crunching on the data each time. Why not cache that data and make available for the next person who requests it? For example, once a person has requested 2010 data for all states (represents 93,281 records) the aggregation on all of that data would not be needed the next time the report were to be requested. Not to mention that we would need to do any sorting either. All we would be pulling down is static values for 3 records. Here is what that script looks like:
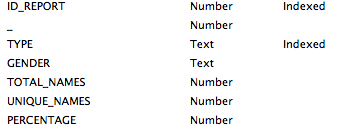
From a schematic perspective we are using 2 tables to accomplish this. A REPORT table to represent every request. Here are the fields in that table:
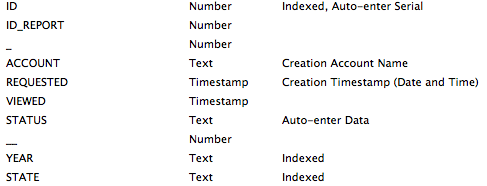
The related REPORT_ITEM table includes the following fields. Remember again here all the values are stored values and once we have a report ready total number of records being pulled are 3.
The file included can be hosted and all the execution can also be performed on the server, or rather should be executed on the server for the maximum performance benefit. Experiment with it and would love to hear feedback and ideas about it.
Some additional things to consider the caching that is possible in this file might not be possible with solutions which have data that is constantly in flux. And more complex sub-summary reports may be overly complex to try to recreate with this method.