If you’ve developed solutions with FileMaker for any length of time, you’ve almost certainly created files using FileMaker’s native Excel exports. Although quite useful, this feature gives almost no control over the formatting, and definitely no way to set formulas, charts, or even text formatting.
However, the Python based XlsxWriter library and bBox can provide an easy way to add this to your solution.
Before we can start, there is a one-time step we must perform. Although quite a few Python libraries are standard in Mac OS, the XlsxWriter module is not, so we must first install the library via a Terminal command:
sudo easy_install XlsxWriter
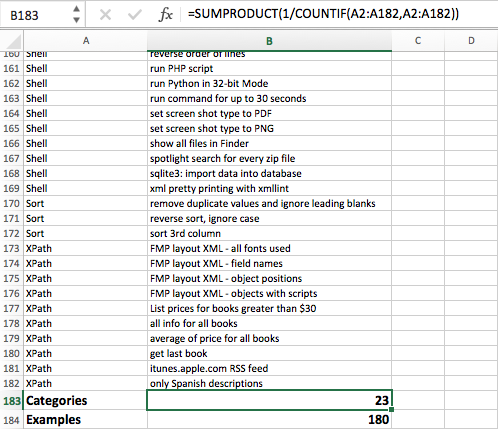
With that done, we’re now ready to go. The first example shows how we can create a worksheet within a workbook file, then add some text formatting for the header. Since the default column widths are fairly narrow (about 8 characters wide), we set the column width to be wide enough to display all the category and example names. Then, we query the FileMaker EXAMPLE table for a list of these, and pump that in to the worksheet. Finally, we add a couple of formulas to summarize the data we’ve added.
FYI, versions of this and the next example are ready to go in the bBox Plug-in download file.
import fm,os,xlsxwriter

# Below sets where we write out the Excel file.
os.chdir ('/tmp')
workbook = xlsxwriter.Workbook('_Examples.xlsx')
worksheet = workbook.add_worksheet()

# Add a bold format to use to highlight cells.
bold14 = workbook.add_format({'bold': True, 'font_size': 14})

# Write some data headers.
worksheet.write('A1', 'Category', bold14)
worksheet.write('B1', 'Name', bold14)

# The default column width is not enough space for categories & names.
worksheet.set_column(0, 0, 20)
worksheet.set_column(1, 1, 40)

# We'll use some data from the FMP EXAMPLE's table to demo with.
examples = fm.executesql ("SELECT category,name FROM EXAMPLE ORDER BY category,name")

# Start from the row below the header.
row = 1
col = 0

# Iterate over the data and write each Excel row.
for category, name in (examples):
    worksheet.write(row, col, category)
    worksheet.write(row, col + 1, name)
    row += 1

# Create some formulas.
rangeTxt = 'A2:A' + str(row)
worksheet.write(row, 0, 'Categories', bold14)
worksheet.write(row, 1, '=SUMPRODUCT(1/COUNTIF(' + rangeTxt + ',' + rangeTxt + '))', bold14)

row += 1
worksheet.write(row, 0, 'Examples', bold14)
worksheet.write(row, 1, row-3, bold14)

workbook.close()
After opening the document in Excel and skipping to the end of the rows we created, you can see that both the formatted text and our calculated values displayed.
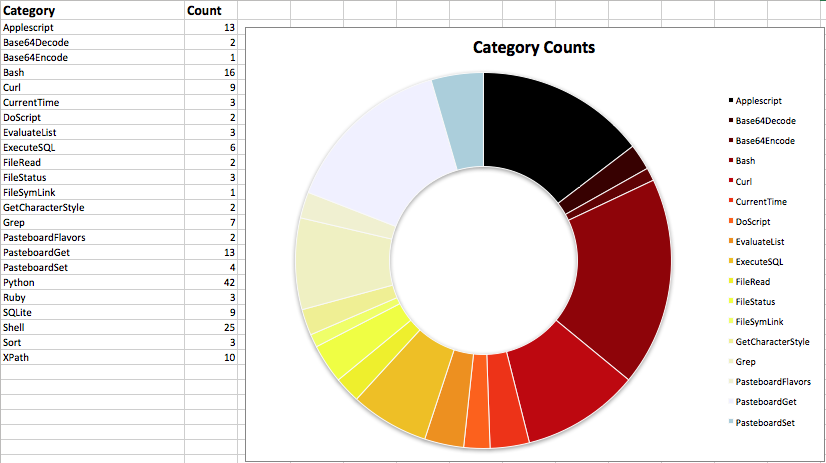
We can take things up a notch further by creating a graph.
import fm,os,xlsxwriter

# Create the workbook file in the /tmp folder and add a worksheet.
os.chdir ('/tmp')
workbook = xlsxwriter.Workbook('_Examples.xlsx')
worksheet = workbook.add_worksheet()

bold14 = workbook.add_format({'bold': True, 'font_size': 14})
worksheet.write('A1', 'Category', bold14)
worksheet.write('B1', 'Count', bold14)

worksheet.set_column(0, 0, 30)

# We'll use some data from the FMP EXAMPLE's table to demo with.
examples = fm.executesql ('SELECT DISTINCT category, COUNT (DISTINCT name) FROM EXAMPLE GROUP BY category')

row = 1
col = 0
exampleLastRowStr = str (len (examples)+row)

for category, count in (examples):
    worksheet.write(row, col,     category)
    worksheet.write(row, col + 1, count)
    row += 1# Create a new Chart object.

chart = workbook.add_chart({'type': 'doughnut'})
chart.set_size({'width': 700, 'height': 680})

# Configure the series and add user defined segment colors.
chart.add_series({
    'name': 'Example',
    'categories': '=Sheet1!$A$2:$A$' + exampleLastRowStr,
    'values':     '=Sheet1!$B$2:$B$' + exampleLastRowStr,
    'points': [
        {'fill': {'color': '#000000'}},
        {'fill': {'color': '#00FF00'}},
        {'fill': {'color': '#0000FF'}},
        {'fill': {'color': '#FF0000'}},
        {'fill': {'color': '#01FFFE'}},
        {'fill': {'color': '#FFA6FE'}},
        {'fill': {'color': '#FFDB66'}},
        {'fill': {'color': '#006401'}},
        {'fill': {'color': '#010067'}},
        {'fill': {'color': '#95003A'}},
        {'fill': {'color': '#007DB5'}},
        {'fill': {'color': '#FF00F6'}},
        {'fill': {'color': '#FFEEE8'}},
        {'fill': {'color': '#774D00'}},
        {'fill': {'color': '#90FB92'}},
        {'fill': {'color': '#0076FF'}},
        {'fill': {'color': '#D5FF00'}},
        {'fill': {'color': '#FF937E'}},
        {'fill': {'color': '#6A826C'}},
        {'fill': {'color': '#FF029D'}},
        {'fill': {'color': '#FE8900'}},
        {'fill': {'color': '#7A4782'}},
        {'fill': {'color': '#7E2DD2'}},
        {'fill': {'color': '#85A900'}},
        {'fill': {'color': '#FF0056'}},
        {'fill': {'color': '#A42400'}},
    ],
})

# Add a title, and set the chart style (colors with white outline and shadow).
chart.set_title({'name': 'Category Counts'})
chart.set_style(10)

# Insert the chart into the worksheet (with an offset), with top-left at cell C2.
worksheet.insert_chart('C2', chart, {'x_offset': 10, 'y_offset': 10})

workbook.close()
And here’s an example of the results:
Although installing the XlsxWriter module is dead easy, for a large deployment it could be enough of a barrier that you’d only want to do this server-side for a solution. If the reports were going to be emailed out, you can simply attach them to an email by first writing your Excel files out to /Library/FileMaker Server/Data/Documents or the script session’s Temp folder. Alternately, if not emailing them, import the file into a container field and save the file locally. A more speculative option, which I haven’t tried yet, could be bundling the XlsxWrite module up by storing its folder in a container field, and exporting the module to the local file system whenever needed, foregoing the need to first install the module.
One thing I’m still playing around with is the color palette. I’d like something where each neighboring color is similar but distinct, and where there are at least 25 different colors. Even better if I can easily generate the list of RGB values programmatically.
Simon
Download the bBox software including this example.
Thank you to Naomi Fujimoto ( https://twitter.com/nomfjmt) who translated this blog post into Japanese:
http://notonlyfilemaker.com/2017/05/excel-formatting-and-charts-from-filemaker-using-xlsxwriter/