If you are having difficulty getting your HTML, CSS, or JavaScript to render in a FileMaker Web Viewer, you may have a struggle ahead of you trying to find the problem, and no good way to debug it. In comparison, most web browsers have debug facilities that can help developers find problems in their code.
Updated for FileMaker 16, 17, 18: This article was originally published July 20, 2015. It has been modified to include newer versions of FileMaker, and older references for versions 14 & 15 were removed.
It turns out if you are using macOS you can get the same facilities found in Safari to debug your code that’s running in a FileMaker Web Viewer.
Enabling Web Inspector
To do this we need to first enable a hidden option. Quit any open copies of FileMaker and start up the Terminal app to execute one or more versions of the command below.
Quit FileMaker if open (it will overwite the plist change).
For FileMaker Pro 16 Advanced (Yes, advanced12 is correct for version 16):
defaults write com.filemaker.client.advanced12 WebKitDebugDeveloperExtrasEnabled -bool YES
For FileMaker Pro 16 and FileMaker Pro 17/18:
defaults write com.FileMaker.client.pro12 WebKitDebugDeveloperExtrasEnabled -bool YES
An important caveat with FileMaker 16 however is that the integrated/attached version will cause FileMaker Pro to crash when you quit. To avoid this, use the window mode buttons at top-left after the Inspector opens:
![]()
You can also try setting the Inspector’s default window mode, however this did not work consistently for us:
defaults write com.filemaker.client.advanced12 "__WebInspectorPageGroupLevel1__.WebKit2InspectorStartsAttached" 1
Using Web Inspector
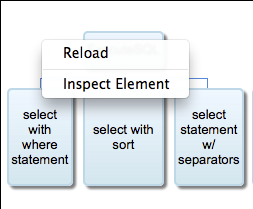
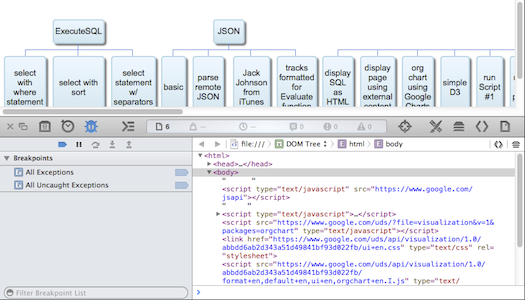
With your plist changes made, start FileMaker back up, and navigate to a layout containing a Web Viewer. Right-click on a Web View, and select Inspect Element from the contextual menu. Voila! You can now debug HTML, CSS, and JavaScript in any Web Viewer.
If you are debugging JavaScript and are trying to catch your code in action, there are some minor tricks required.
One issue is that the debugger will go away whenever the Web Viewer is not displayed. Annoyingly, this also clears any previously set breakpoints. So for debugging JavaScript code you probably want to take advantage to the debugger extensions added to JavaScript. These are documented on table 5-2 of the Safari Inspector Guide.
A partial list of functions are:
- console.assert(expression, object)
- console.log(object)
- console.profile([title])
- console.trace()
- debug (expression)
- debugger
None of these debugger functions will work until the Inspector has been activated, so enable it as soon as possible with the contextual menu on the Web Viewer. But at least the debugger breakpoints will persist each time the web viewer is reloaded.
Simon
References
The original method above was not working for FMP 16, so there’s an updated method for FileMaker 16 added to the blog post.
Great stuff, Simon! This is a huge help for all of us who work a lot with FileMaker and JavaScript in the WebViewer. Thanks!